Modern Blue Presentation Area Chart - Optimized for Market Analysis
RJ0200035_20
- Last Update 04/07/2025
- File Size 0.6MB
- # of Slides 2
- File Format PPTX
- Slide Ratio 16:9
- Color
Keywords
About the Product
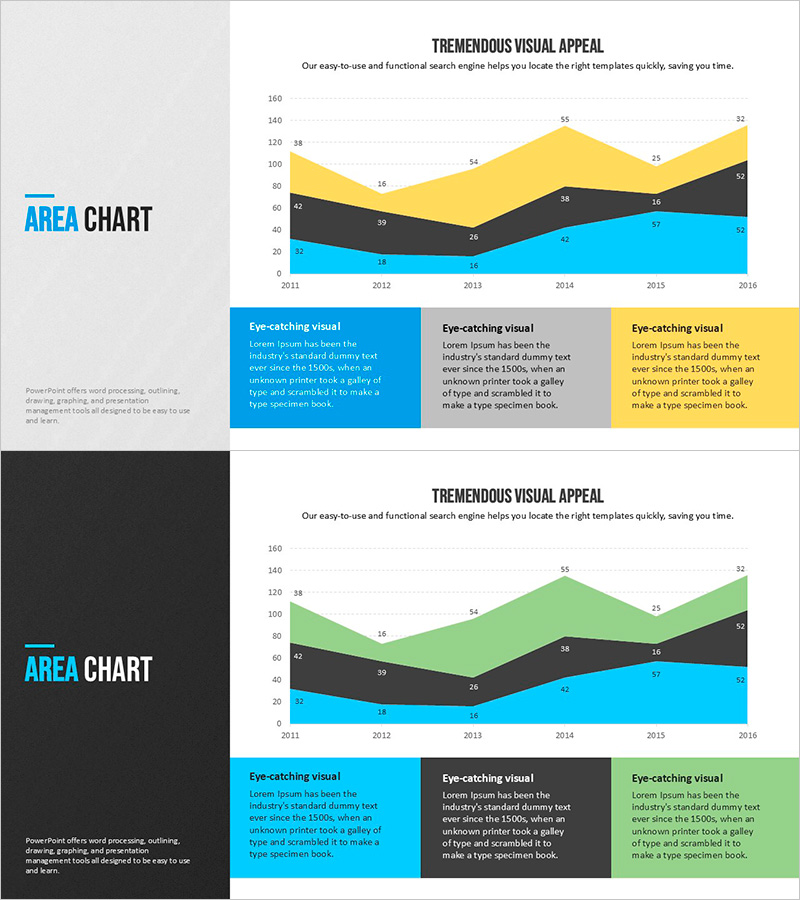
A stacked area chart PowerPoint slide optimized for market analysis and competitive comparison. This presentation template visualizes six years of data trends (2011-2016) across three series in blue, black, and yellow, making it easy to compare cumulative growth and individual category performance. The layered area design allows viewers to see both total volume and component changes simultaneously. Perfect for business reports, marketing presentations, and investor pitches where numerical data needs clear visual communication. All colors and data points are fully editable.
Usage Points
-
Main Usage
Displays multi-series time-series data as cumulative stacked areas, enabling simultaneous visualization of total growth and individual component trends. Ideal for market size evolution, revenue progression, customer segment distribution changes, and competitive market share analysis.
-
How to Use
Input your annual data values into each data point, and the stacked areas automatically adjust proportionally. Customize series colors to match your brand palette, and edit title and axis labels to fit your specific analysis topic. Works seamlessly with Excel data integration.
-
Recommended For
Marketing teams presenting market research findings, executive reports on performance trends, business plan market size projections, investor pitch decks showing revenue growth trajectories. Suitable for finance, retail, manufacturing, and technology sectors.
-
Slide Structure
2-slide deck. Slide 1 features a 3-series stacked area chart (blue, black, yellow) spanning 2011-2016 with 6 data points, plus three descriptive text boxes below. Slide 2 presents the same chart structure in green color scheme for design flexibility. Both slides maintain consistent layout and 16:9 aspect ratio.
Related Products
-

Simple Car Wide Presentation Area Chart
#Market and Competitor Analysis #Graph #Other
-

Marketing Activity Monitoring Dashboard – Market Trend Analysis
#Market and Competitor Analysis #Graph #Other
-

Business Forest Wide Template Area Chart
#Market and Competitor Analysis #Graph #Other
-

Area Chart for Market Trend Analysis – Insights and Growth
#Market and Competitor Analysis #Financial Plans and Performance #Graph
