Competitor Analysis Line Chart – Business Meeting Template Cover
RJ0300013_17
- Last Update 04/21/2025
- File Size 4.9MB
- # of Slides 2
- File Format PPTX
- Slide Ratio 16:9
- Color
Keywords
- #Content-Based Slides
- #Design-Based Slides
- #Business Strategy
- #Market and Competitor Analysis
- #Graph
- #Financial Outlook & Expected Impact
- #Competitor Analysis
- #Line
- #Line Chart
- #16:9
- #line chart PowerPoint slide
- #multi-series trend comparison
- #competitor analysis chart
- #market analysis graph
- #business presentation template
About the Product
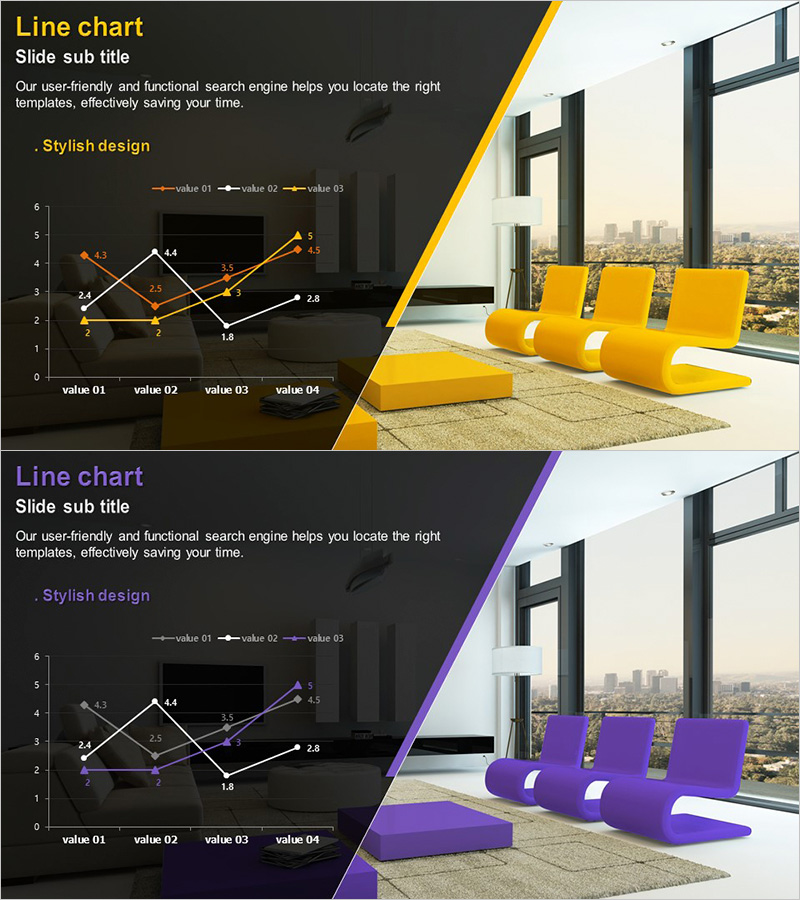
A multi-series line chart PowerPoint slide designed for competitive analysis and market trend visualization. This presentation template features three data series plotted across four time points, available in two color themes: yellow and purple. Each slide combines a dark background with clear numerical labels, legend, and axis markers for professional business presentations. The 16:9 widescreen format includes 2 fully editable slides in PPTX format, ready for immediate use in business meetings, strategy presentations, and performance reviews.
Usage Points
-
Main Usage
Compare three or more data series over time, such as competitor performance, market share, or sales trends. The intersecting lines and upward/downward patterns clearly communicate competitive advantages and improvement opportunities to stakeholders.
-
How to Use
Replace sample data with your actual figures by editing the data points on each line. Select the yellow theme to emphasize growth and positivity, or the purple theme to convey trust and professionalism. Use in executive briefings, investor presentations, and quarterly business reviews.
-
Recommended For
Marketing managers, sales directors, executives, consultants, and business analysts presenting competitive benchmarking, market dynamics, and performance trends. Ideal for quarterly/annual comparisons, product-line sales tracking, and customer satisfaction trend analysis.
-
Slide Structure
Each slide contains a title area, three-line graph with four data points per series, color-coded legend, and labeled axes. A diagonal accent line in yellow or purple frames the chart against the dark background. All text and numerical values are editable text boxes for customization.
Related Products
-

Visualizing Menu Sales Status with Line Chart
#Market and Competitor Analysis #Graph #Competitor Analysis
-

Target Market Trend Analysis Graph by Year – Market and Competitor Analysis
#Market and Competitor Analysis #Diagram #Graph
-

Competitor Market Analysis Broken Line Graph – Enhance Business Strategy with Data Visualization
#Market and Competitor Analysis #Diagram #Graph
-

Competitor 3D Broken Line Graph – Competitive Advantage Analysis
#Market and Competitor Analysis #Graph #Competitor Analysis
