Analysis of Modern Theme Market Trends – Valuable Insights
RJ0300013_12
- Last Update 04/21/2025
- File Size 2.1MB
- # of Slides 2
- File Format PPTX
- Slide Ratio 16:9
- Color
Keywords
- #Content-Based Slides
- #Design-Based Slides
- #Market and Competitor Analysis
- #Graph
- #Future Outlook
- #Industry Trends
- #Column
- #Column Chart
- #16:9
- #column chart PowerPoint
- #horizontal bar chart slide
- #vertical bar graph template
- #market analysis chart
- #competitive comparison graph
- #data visualization presentation
- #business analytics slide
About the Product
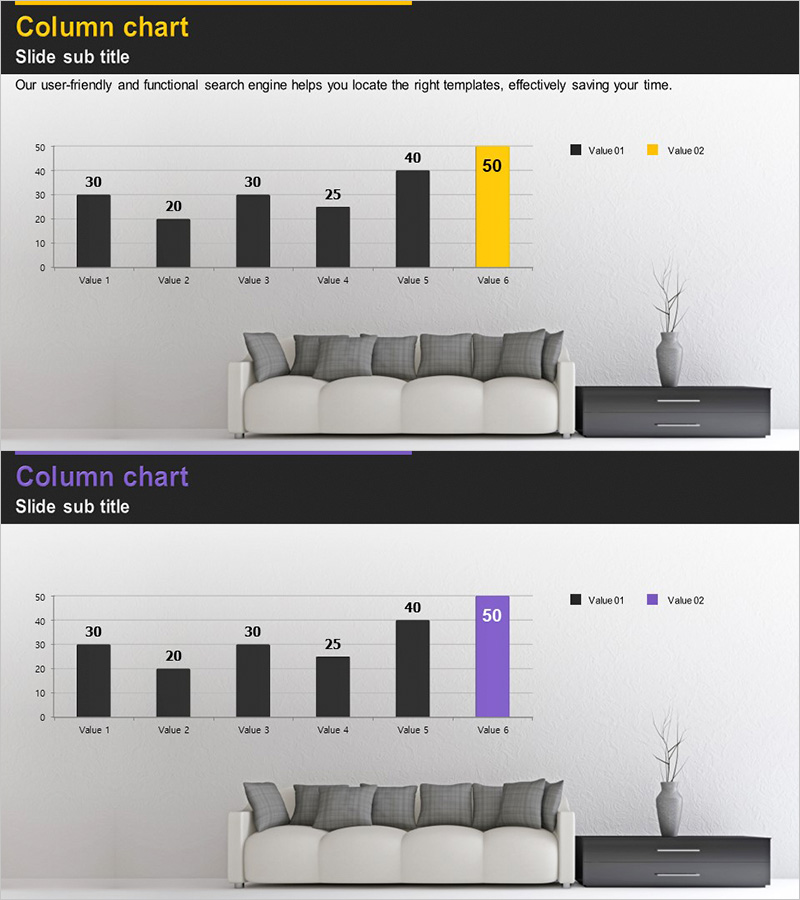
A professional column chart PowerPoint slide designed for market trend analysis and competitive comparison presentations. This 2-slide template presents the same dataset in both horizontal and vertical bar chart formats, allowing you to choose the layout that best suits your presentation context. The dark header background contrasts with the light gray chart area to enhance data readability. Key values (Value 6) are highlighted in yellow and purple to emphasize critical metrics. The template effectively displays 6-item comparisons with dual-series data visualization for impactful business presentations.
Usage Points
-
Main Usage
Ideal for market trend analysis, competitive benchmarking, sales performance comparison, and departmental results reporting. The dual-layout approach (horizontal and vertical) enables multi-perspective data visualization to enhance audience comprehension and engagement.
-
How to Use
Replace the sample values (30, 20, 30, 25, 40, 50) with your actual data and update the legend labels (Value 01, Value 02) to match your categories. Highlight key metrics by changing the bar color to yellow or purple. Customize the slide title and subtitle to align with your presentation topic.
-
Recommended For
Marketing professionals presenting market analysis, sales teams reporting performance metrics, executives reviewing competitive analysis, consulting firms preparing client proposals, and students presenting market research projects.
-
Slide Structure
2-slide set. Slide 1 features a horizontal column chart (6 items, 2 series, black and yellow highlight). Slide 2 displays a vertical column chart (same data, black and purple highlight). Both slides include a dark header section with title and subtitle, plus decorative furniture imagery and design elements at the bottom.
Related Products
-

Graphs that draw a successful future outlook – Visualizing Market Trends
#Market and Competitor Analysis #Graph #Other
-

Market Trends and Analysis Charts – Delivering Business Insights
#Business Strategy #Market and Competitor Analysis #Graph
-

Column Chart for Market and Competitor Analysis – Modern Business Strategy
#Business Strategy #Market and Competitor Analysis #Graph
-

Donation Participation Rate Graph – Business Strategy and Future Outlook
#Business Strategy #Market and Competitor Analysis #Graph
