Market Trends and Analysis Charts – Delivering Business Insights
RM0600007_9
- Last Update 02/25/2025
- File Size 0.2MB
- # of Slides 2
- File Format PPTX
- Slide Ratio 16:9
- Color
Keywords
- #Content-Based Slides
- #Design-Based Slides
- #Business Strategy
- #Market and Competitor Analysis
- #Graph
- #Achievements
- #Future Outlook
- #Industry Trends
- #Column
- #Circles
- #Column Chart
- #Doughnut Chart
- #16:9
- #donut chart PowerPoint
- #pie chart slide template
- #market analysis presentation
- #business data visualization
- #donut graph slide download
About the Product
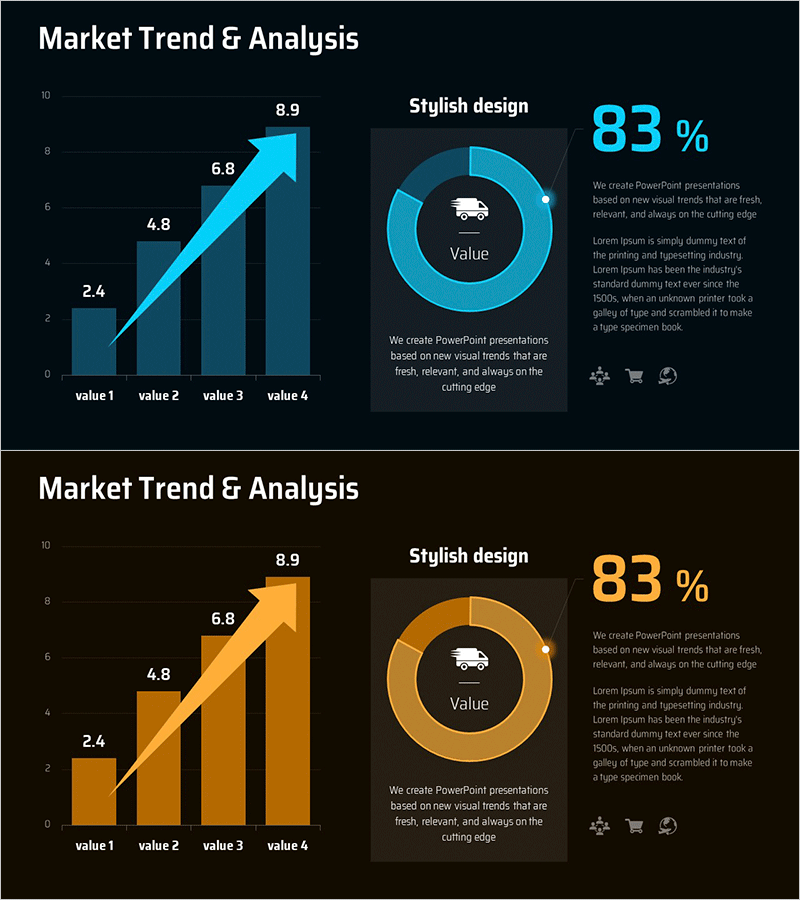
A 2-slide PowerPoint set visualizing market trends and business insights with donut charts. The left side features a line graph showing upward progression (2.4→4.8→6.8→8.9) with descriptive text, while the right side displays an 83% ratio using a donut-shaped pie chart with a centered icon. Available in two color schemes—cyan and orange—on dark backgrounds, making it instantly applicable to corporate presentations, marketing analysis, financial reports, and business intelligence decks. Provided in 16:9 widescreen PPTX format, fully editable across all presentation software.
Usage Points
-
Main Usage
Express market share, customer satisfaction, achievement rates, and other ratio data using donut charts while simultaneously showing trend changes over time with line graphs. Integrate quantitative metrics and qualitative insights on a single slide for executive briefings, investor presentations, and strategic marketing announcements.
-
How to Use
Slide 1 features a cyan background while Slide 2 uses an orange background, allowing you to select based on your presentation tone. Double-click the chart in PowerPoint to instantly update data values, then edit the text box descriptions. Colors, fonts, and chart sizes are fully customizable to match your brand guidelines.
-
Recommended For
Executive and C-suite reports, investor pitch decks, quarterly and annual business performance reviews, marketing campaign effectiveness analysis, market research presentations, financial performance analysis, customer satisfaction survey results, strategic planning meetings, and all data-driven business presentations requiring visual evidence for decision-making.
-
Slide Structure
Both slides share identical layout: 'Market Trend & Analysis' title at top-left, 4-point line graph (2.4, 4.8, 6.8, 8.9) at bottom-left, 'Stylish design' text at top-right, donut-shaped pie chart with centered vehicle icon (83% representation) at center-right, and descriptive text area at bottom-right.
Related Products
-

Vertical Bar Graph Flow – Market and Performance Analysis
#Business Strategy #Market and Competitor Analysis #Graph
-

Contribution of Environmental Factors to Growth – Donut Chart
#Business Strategy #Market and Competitor Analysis #Graph
-

Performance Column Graph – Business Strategy and Competitor Analysis
#Business Strategy #Market and Competitor Analysis #Graph
-

Analysis of Modern Theme Market Trends – Valuable Insights
#Market and Competitor Analysis #Graph #Future Outlook
