Donation Participation Rate Graph – Business Strategy and Future Outlook
RJ0600088_22
- Last Update 07/14/2025
- File Size 0.4MB
- # of Slides 2
- File Format PPTX
- Slide Ratio 16:9
- Color
Keywords
- #Content-Based Slides
- #Design-Based Slides
- #Business Strategy
- #Market and Competitor Analysis
- #Graph
- #Financial Outlook & Expected Impact
- #Future Outlook
- #Column
- #Column Chart
- #16:9
- #donation participation rate chart
- #horizontal bar chart PowerPoint
- #numerical comparison slide
- #business strategy presentation
- #data visualization PPT
- #chart slide template
About the Product
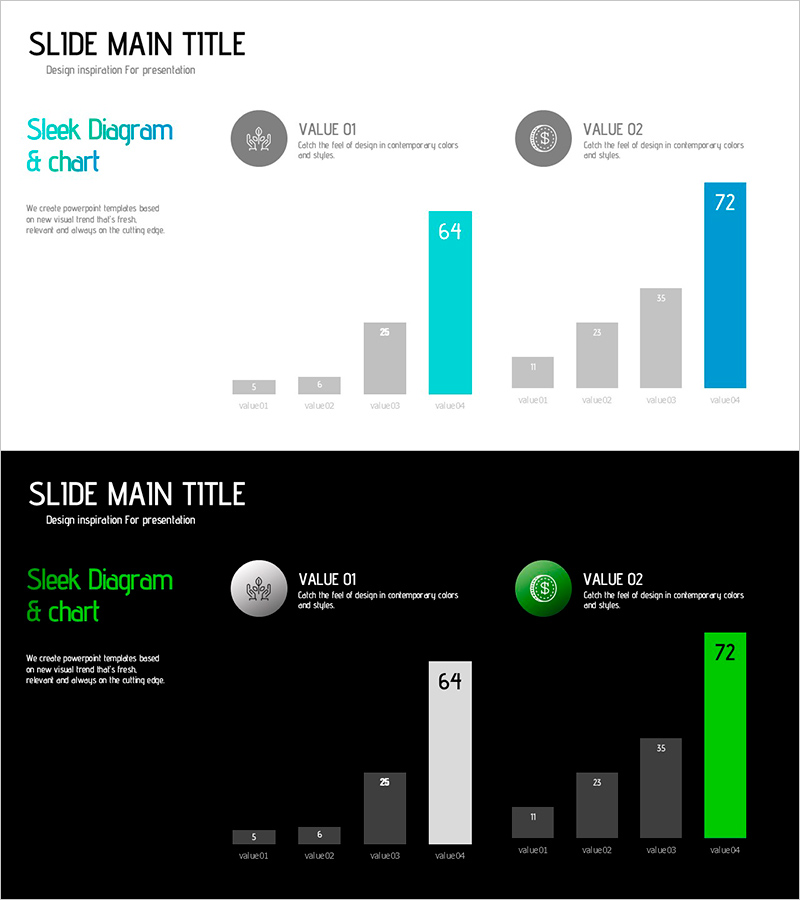
A horizontal bar chart PowerPoint slide that visualizes donation participation rate data across eight items. The chart uses teal and gray color differentiation to enable comparative analysis, with the highest value (72) emphasized through color contrast to highlight critical data. The upper VALUE 01 and VALUE 02 icon section allows additional explanation of key metrics, making it immediately applicable to business strategy presentations, future outlook reports, and market analysis materials. Provided in 16:9 ratio PPTX format with all elements fully editable.
Usage Points
-
Main Usage
Optimized for comparing multi-item numerical data such as donation participation rates, revenue forecasts, and market share at a glance while emphasizing rankings. The teal accent color visually highlights the maximum value to increase audience attention.
-
How to Use
Use in business strategy presentations, quarterly performance reports, market analysis materials, and investor pitch decks to convey quantitative data persuasively. Add key metrics to the upper VALUE section to aid graph interpretation.
-
Recommended For
Recommended for executives, marketing teams, sales teams, finance teams, and planning teams requiring data-driven decision-making. Also suitable for CSR-related presentations including donation fundraising status, fund formation plans, and social contribution performance reports.
-
Slide Structure
Composed of title area at top, explanatory text on left, VALUE 01 and VALUE 02 icon section in center, and 8-item horizontal bar chart on right. Bars are differentiated between gray baseline values and teal emphasis values, with numerical labels displayed above each item.
Related Products
-

Technology Service Future Outlook and Expected Effect – High-Quality Graph Design
#Business Strategy #Market and Competitor Analysis #Graph
-

Elevation Graph Above Sofa Image - Visualizing Business Growth
#Business Strategy #Market and Competitor Analysis #Graph
-

Denim PPT Vertical Bar Graph Analysis – Market and Competitor Analysis
#Business Strategy #Market and Competitor Analysis #Graph
-

Growth Prospects Graph – Business Strategy Development
#Business Strategy #Market and Competitor Analysis #Graph
