Market Share Graph by Sector – Visual Efficiency
RJ0300013_10
- Last Update 04/21/2025
- File Size 2.7MB
- # of Slides 2
- File Format PPTX
- Slide Ratio 16:9
- Color
Keywords
- #Content-Based Slides
- #Design-Based Slides
- #Product/Service Introduction
- #Market and Competitor Analysis
- #Graph
- #Development Status
- #Market Share
- #Circles
- #Doughnut Chart
- #16:9
- #doughnut chart PowerPoint
- #pie chart slide template
- #ratio analysis presentation
- #market share visualization
- #donut chart download
- #PowerPoint graph slide design
About the Product
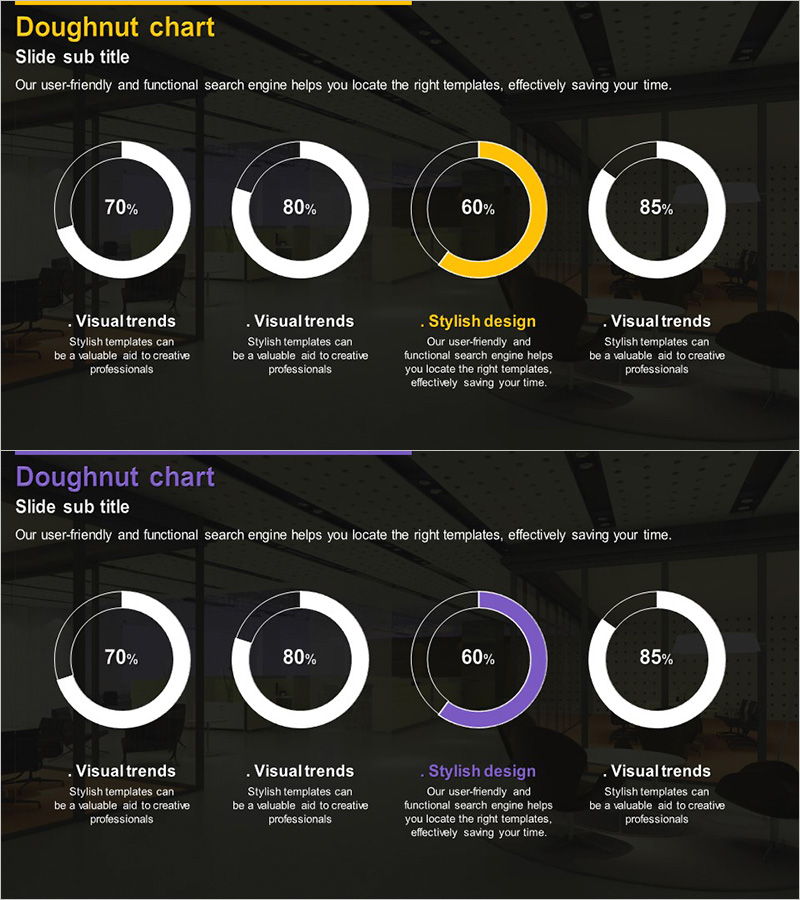
A professional doughnut chart PowerPoint slide designed to visualize market share, sales distribution, customer composition, and other ratio-based data. The dark background features four circular graphs with white and accent colors (yellow and purple) that clearly display percentage values for each item. The 2-slide set allows you to present multiple data sets simultaneously, with dedicated text areas below each chart for contextual explanations. Fully editable in PPTX format—simply update the numbers and labels to match your data.
Usage Points
-
Main Usage
Clearly communicate market share, revenue distribution, customer segmentation, budget allocation, and other proportional data. The hollow center of each doughnut allows you to place key metrics or titles for added emphasis and visual impact.
-
How to Use
Use in business reports, marketing presentations, and strategic analysis meetings to support data-driven decision-making. Fill in the text areas below each chart with item names and interpretations to enhance audience comprehension and engagement.
-
Recommended For
Finance professionals, marketing managers, executives, consultants, and data analysts who need to present quantitative insights. Ideal for quarterly performance reviews, market research presentations, and strategic planning sessions.
-
Slide Structure
2-slide set with 4 doughnut charts per slide arranged horizontally (sample data: 70%, 80%, 60%, 85%). Each chart is accompanied by a text area below for item labels and descriptions. Dark background with white borders and accent colors (yellow and purple) highlight key data points.
Related Products
-

City Theme Market Share Graph – Business Data Visualization
#Product/Service Introduction #Market and Competitor Analysis #Graph
-

Analysis of Transportation Usage Status – Pie Chart
#Product/Service Introduction #Market and Competitor Analysis #Graph
-

Development Status Analysis Donut Chart – Market Share Visualization
#Product/Service Introduction #Market and Competitor Analysis #Graph
-

Analysis graph of market share progress
#Product/Service Introduction #Market and Competitor Analysis #Graph
