Comparative Analysis Area Graph – Market and Competitor Analysis
RJ0300011_9
- Last Update 04/21/2025
- File Size 0.2MB
- # of Slides 2
- File Format PPTX
- Slide Ratio 16:9
- Color
Keywords
- #Content-Based Slides
- #Design-Based Slides
- #Market and Competitor Analysis
- #Graph
- #Other
- #Competitor Analysis
- #Future Outlook
- #Other
- #Area Chart
- #16:9
- #area chart PowerPoint
- #area graph template
- #trend comparison slide
- #market analysis chart
- #competitive analysis PowerPoint
- #data visualization slide
- #how to create area chart in PowerPoint
About the Product
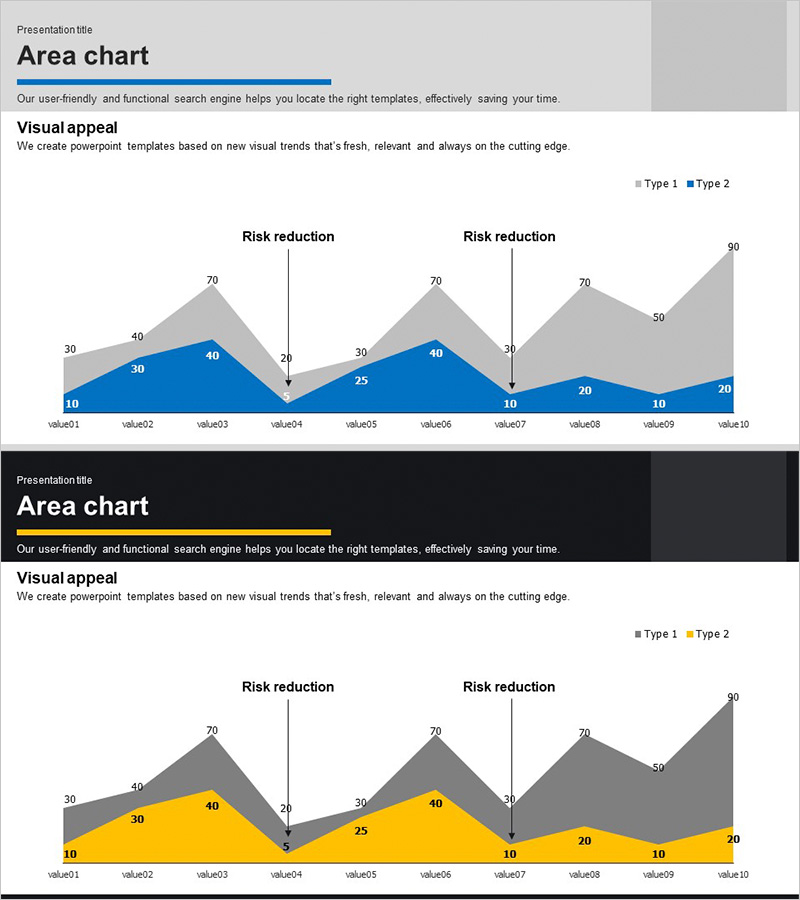
An area chart PowerPoint slide optimized for market analysis and competitive comparison. This presentation template visualizes two data series as stacked or overlapping areas, enabling simultaneous display of trend changes and relative magnitude across ten time points. The blue and gray gradient design effectively represents risk reduction, market share evolution, performance benchmarking, and other business metrics. Each data point is clearly labeled with numerical values for precise information delivery. The 16:9 widescreen format includes two ready-to-edit slides that can be immediately integrated into business presentations.
Usage Points
-
Main Usage
Displays two or more data series as areas to simultaneously convey trend changes and relative magnitude comparisons over time. Ideal for visualizing market share evolution, risk reduction trajectories, competitive performance benchmarking, and cumulative or comparative business metrics that require time-series analysis.
-
How to Use
Input your actual data directly into the area chart template for immediate use. Replace the legend labels (Type 1 and Type 2) with your comparison categories and update the numerical values at each time point. The area heights automatically adjust to reflect your data. Insert into presentation decks, reports, and proposals to support data-driven decision-making.
-
Recommended For
Marketing professionals analyzing market share trends, sales managers reporting performance metrics, strategy planners conducting competitive analysis, finance teams comparing costs and revenues, and project managers tracking risk reduction progress. Suitable for business plans, quarterly reports, investor pitch decks, and strategic presentations.
-
Slide Structure
Two-slide template featuring identical area chart layouts. Each slide contains ten X-axis data points (value01 through value10) and two Y-axis data series (Type 1 and Type 2). Blue and gray gradient areas overlap to show comparative relationships, with numerical labels at each data point. Includes dedicated title and description text areas for context and interpretation.
Related Products
-

Gradient Theme Area Diagram – Market and Competitor Analysis
#Market and Competitor Analysis #Diagram #Graph
-

Purple Blue Area Chart – Dynamic Data Visualization for Market and Competitive Analysis
#Market and Competitor Analysis #Graph #Other
-

Goal Achievement Analysis Area Graph – Data-driven Competitive Edge
#Market and Competitor Analysis #Graph #Other
-

Future Outlook Analysis Graph – Market and Competitive Analysis
#Market and Competitor Analysis #Graph #Other
