Future Outlook Analysis Graph – Market and Competitive Analysis
RJ0400048_12
- Last Update 05/30/2025
- File Size 0.8MB
- # of Slides 2
- File Format PPTX
- Slide Ratio 16:9
- Color
Keywords
- #Content-Based Slides
- #Design-Based Slides
- #Market and Competitor Analysis
- #Graph
- #Other
- #Competitor Analysis
- #Future Outlook
- #Horizontal Bar
- #Grouped Horizontal Bar
- #Mockup
- #16:9
- #horizontal bar chart PowerPoint
- #bar graph slide template
- #market analysis chart
- #competitive analysis graph
- #5-year trend data visualization
About the Product
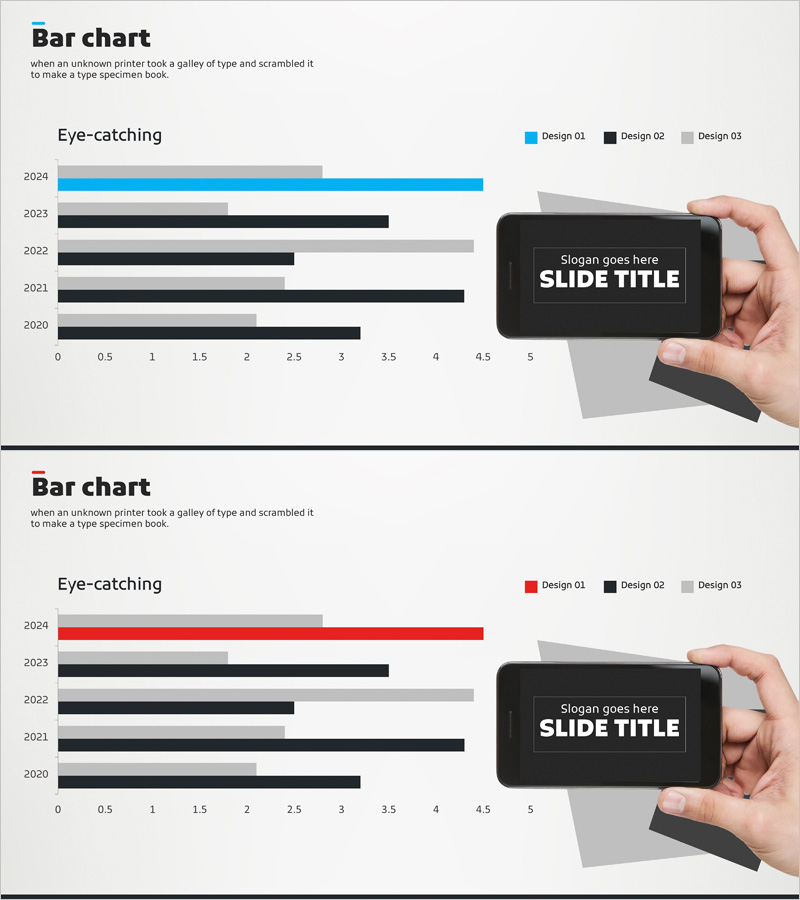
A horizontal bar chart PowerPoint slide designed for market outlook and competitive analysis presentations. This template visualizes 5-year data from 2020 to 2024 across three series (Design 01 in blue, Design 02 in black, Design 03 in gray) for clear numerical comparison and trend identification. The bar lengths enable intuitive data visualization suitable for market size changes, competitor performance benchmarking, revenue trends, and other analytical presentations. The 16:9 format includes 2 fully editable slides ready for immediate use.
Usage Points
-
Main Usage
This chart excels at comparing year-over-year data changes and multiple items simultaneously. Perfect for visualizing market size trends, competitor performance metrics, departmental revenue changes, product category sales volumes, and other time-series data with multiple data series in a single view.
-
How to Use
Integrate this slide into business reports, investor presentations, and strategic briefings within the market analysis section. The bar lengths and color differentiation make numerical comparisons immediately clear, while chronological arrangement effectively communicates trend progression. Simply input your data values for instant chart updates.
-
Recommended For
Ideal for executives, marketing managers, financial analysts, management consultants, and sales leaders who rely on data-driven decision-making. Particularly valuable for market situation analysis, competitive strategy development, and performance evaluation presentations.
-
Slide Structure
Two-slide set with the first slide emphasizing blue series and the second emphasizing black series. Each slide displays 5 years (2020–2024) on the Y-axis and a 0–5 numerical scale on the X-axis, with three data series bars arranged side-by-side for each year to facilitate comparative analysis.
Related Products
-

Visualizing Business Strategy with Bar Charts – Market Analysis and Future Outlook
#Market and Competitor Analysis #Diagram #Graph
-

Competitor Analysis PC Mockup Graph – Market Trends and Insights
#Market and Competitor Analysis #Graph #Other
-

Competitor Analysis and Market Trends Graph – Contrast of Blue and Red
#Market and Competitor Analysis #Graph #Competitor Analysis
-

Modern Business PowerPoint Template – Business Strategy and Market Analysis
#Business Strategy #Market and Competitor Analysis #Graph
