Purple Blue Area Chart – Dynamic Data Visualization for Market and Competitive Analysis
RJ0900009_18
- Last Update 08/18/2025
- File Size 0.1MB
- # of Slides 2
- File Format PPTX
- Slide Ratio 16:9
- Color
Keywords
About the Product
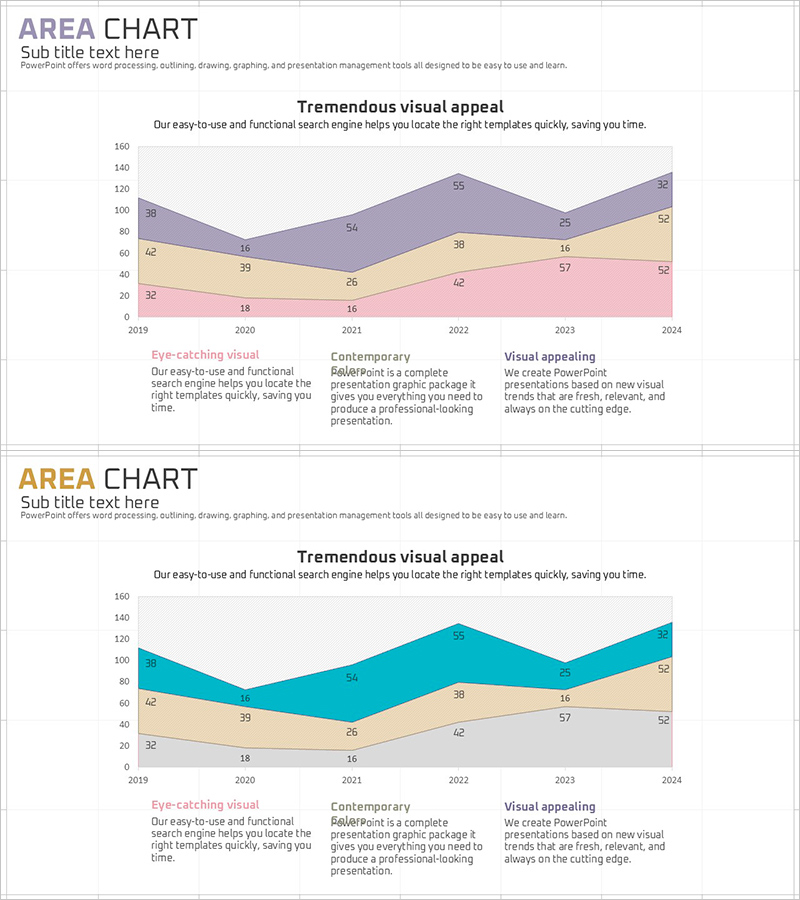
A PowerPoint area chart slide visualizing market trends from 2019 to 2024 across three distinct data layers. The chart uses purple, beige, and pink color zones to represent different data categories and their changes over time. Includes text input areas for titles, descriptions, and insights, making it immediately applicable to market analysis, competitive benchmarking, and business performance presentations. Provided in 16:9 widescreen PPTX format with editable data labels and fully customizable layout for professional data visualization.
Usage Points
-
Main Usage
Enables simultaneous comparison of multiple data categories over time, such as market share, competitive positioning, or business performance trends. The stacked area format shows both total volume and individual layer contributions, supporting data-driven decision-making and strategic planning.
-
How to Use
Enter your analysis title and subtitle in the header area. Replace chart data labels with actual figures and fill in the three description text boxes below with key insights for each data layer. Customize colors if needed and the slide is ready for presentation.
-
Recommended For
Executive reports, investor presentations, business planning sessions, market analysis briefings, and quarterly/annual performance reviews. Ideal for executives, business analysts, strategists, and marketing professionals who need to present multi-dimensional data trends.
-
Slide Structure
Header section with title and subtitle, central 3-layer stacked area chart spanning 6 time points (2019-2024), and three text boxes below for layer descriptions. Each data layer is color-coded with embedded numeric labels for enhanced readability and data accuracy.
Related Products
-

Future Outlook Analysis Graph – Market and Competitive Analysis
#Market and Competitor Analysis #Graph #Other
-

Comparative Analysis Area Graph – Market and Competitor Analysis
#Market and Competitor Analysis #Graph #Other
-

Three-Dimensional Graph Analysis – Market and Competitor Analysis Slide
#Product/Service Introduction #Market and Competitor Analysis #Marketing Plan and Strategy
-

Brown Green Area Chart – Data Trend Analysis
#Market and Competitor Analysis #Graph #Other
