Business Expected Effects Analysis Graph
RJ0300011_10
- Last Update 04/21/2025
- File Size 0.2MB
- # of Slides 2
- File Format PPTX
- Slide Ratio 16:9
- Color
Keywords
About the Product
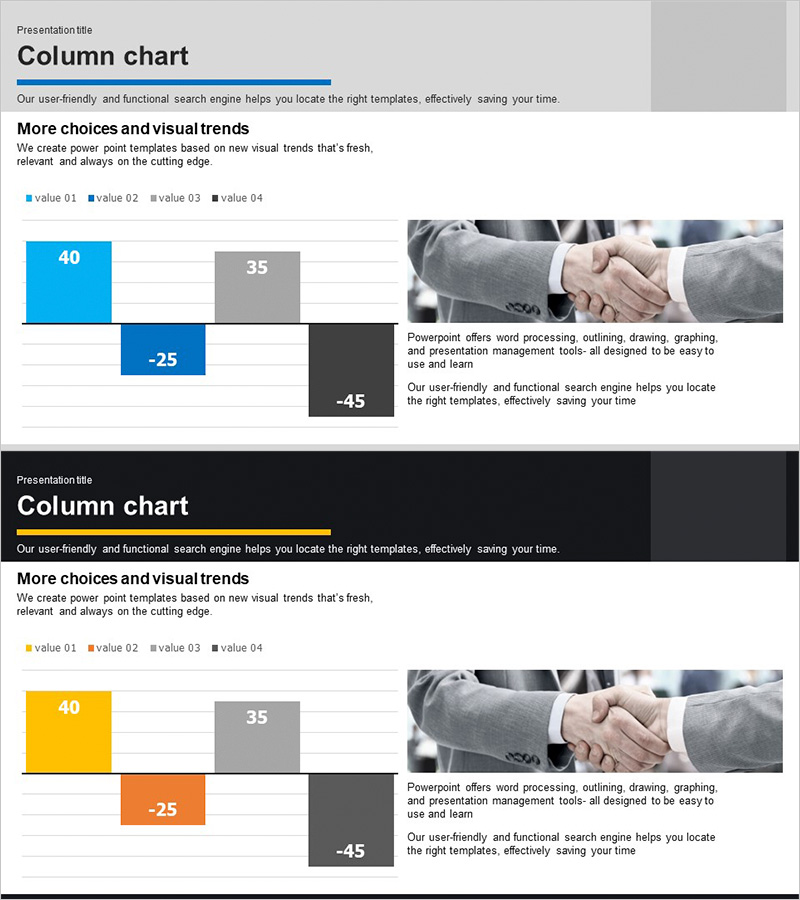
A PowerPoint slide designed to visually analyze business expected effects and strategic outcomes. Features a mixed column and bar chart with three color series (blue, gray, black) comparing four data items, enabling flexible data representation. The right side includes a business image area and text description space for qualitative context. This 16:9 widescreen 2-slide set is ready for immediate use in presentations.
Usage Points
-
Main Usage
Visually compare and analyze four key metrics such as business expected effects, revenue projections, and performance indicators using mixed column and bar charts. The dual-format approach supports diverse data visualization needs for strategic decision-making.
-
How to Use
Edit the numerical values in each bar to input your actual business data. Replace the right-side image with relevant business photos and modify the text description to match your presentation context. Color series (blue, gray, black) can be customized to align with corporate branding.
-
Recommended For
Ideal for business plans, investor pitch decks, executive reports, and strategic presentations where quantifying expected effects and profitability is essential. Particularly valuable for finance teams, strategy departments, and C-level presentations.
-
Slide Structure
2-slide set. Each slide contains a mixed column and bar chart (three color series: blue, gray, black) representing four data items, a business image area on the right, and an editable text description box. Optimized for 16:9 widescreen format in modern presentation environments.
Related Products
-

Donation Participation Rate Graph – Business Strategy and Future Outlook
#Business Strategy #Market and Competitor Analysis #Graph
-

Target Performance and Expected Results – Visualized with Vertical Bar Charts
#Business Strategy #Graph #Financial Outlook & Expected Impact
-

Bar and Column Charts Investigating Important Factors in Marriage
#Business Vision and Strategy #Business Strategy #Graph
-

Future Outlook Vertical Bar Graph – Business Strategy Analysis
#Business Strategy #Market and Competitor Analysis #Graph
