Soccer Illustration and Vertical Bar Graph – Market Analysis and Business Strategy Product
RJ0600037_9
- Last Update 07/01/2025
- File Size 0.6MB
- # of Slides 2
- File Format PPTX
- Slide Ratio 16:9
- Color
Keywords
- #Content-Based Slides
- #Design-Based Slides
- #Business Strategy
- #Market and Competitor Analysis
- #Graph
- #Financial Outlook & Expected Impact
- #Future Outlook
- #Column
- #Column Chart
- #16:9
- #vertical bar chart PowerPoint
- #bar graph slide template
- #data comparison chart
- #market analysis PPT
- #business strategy presentation
- #PowerPoint slide design
About the Product
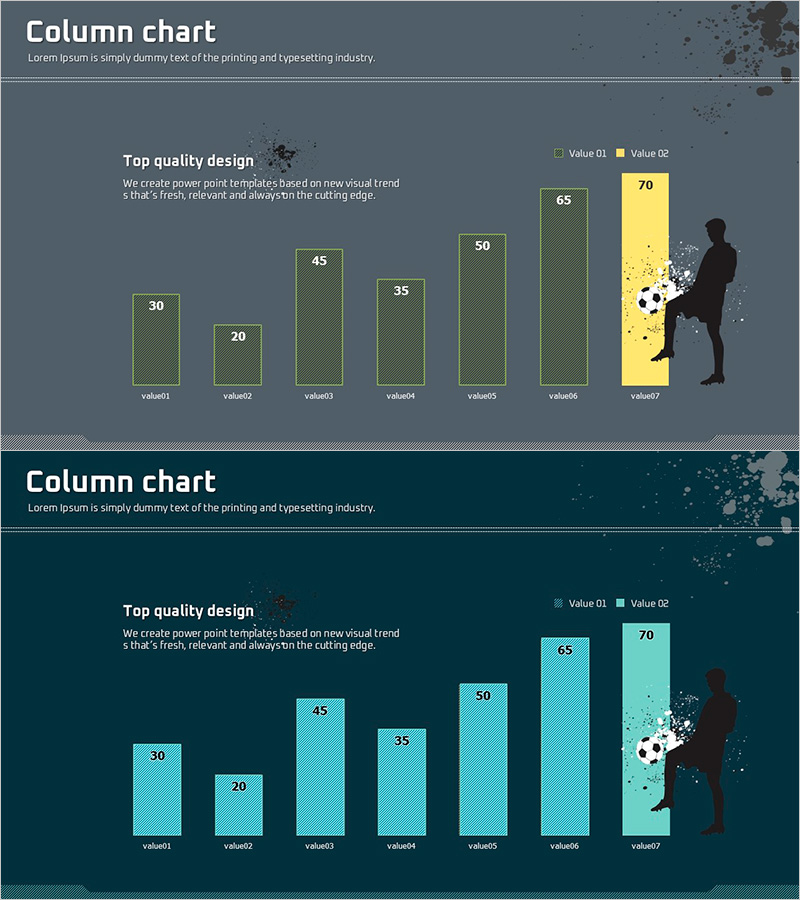
A professional vertical bar chart PowerPoint slide designed for market analysis and business strategy presentations. This slide template visualizes 7 data points with clear numerical comparison, enhanced by a soccer illustration that adds context to sports, entertainment, and marketing sectors. The color scheme combines dark gray background with lime green and yellow bars, maximizing data emphasis and contrast. Two data series (Value 01 and Value 02) enable comparative analysis, with numerical labels displayed on each bar for immediate usability. Available in 16:9 widescreen PPTX format, fully compatible with modern presentation environments.
Usage Points
-
Main Usage
Visualizes quantitative data for market analysis, business strategy, and revenue forecasting. Enables simultaneous comparison of 7 data points and distinguishes between two data series (Value 01 and Value 02). The soccer illustration provides visual context for sports, entertainment, and marketing sector presentations.
-
How to Use
Bar height and color intuitively convey data magnitude and series differentiation. Pre-positioned numerical labels allow immediate use with data modification only. Dark gray background with lime green and yellow bars creates strong contrast, ensuring excellent readability in projector and screen presentations.
-
Recommended For
Marketing managers, planners, analysts, and executives presenting market size, competitor comparison, sales performance, and customer satisfaction metrics. Ideal for sports industry, media, advertising, and entertainment sector business reports, strategy meetings, and investor presentations.
-
Slide Structure
Slide 1: Title area + descriptive text + 7-item vertical bar chart (lime green) + legend (Value 01, Value 02) + soccer illustration. Slide 2: Identical structure with dark gray, lime green, and yellow color variation. Numerical labels (20–70) on each bar, dual-series data comparison enabled.
Related Products
-

Donation Participation Rate Graph – Business Strategy and Future Outlook
#Business Strategy #Market and Competitor Analysis #Graph
-

Column Chart for Market and Competitor Analysis – Modern Business Strategy
#Business Strategy #Market and Competitor Analysis #Graph
-

Utilization Rate of Oriental Medicine Clinics by Age – Market and Competitor Analysis
#Business Strategy #Market and Competitor Analysis #Graph
-

Growth Prospects Graph – Business Strategy Development
#Business Strategy #Market and Competitor Analysis #Graph
