Vertical Bar Chart for Achieving Goals – Growth and Fulfillment
RB0800011_17
- Last Update 03/19/2025
- File Size 7.7MB
- # of Slides 2
- File Format PPTX
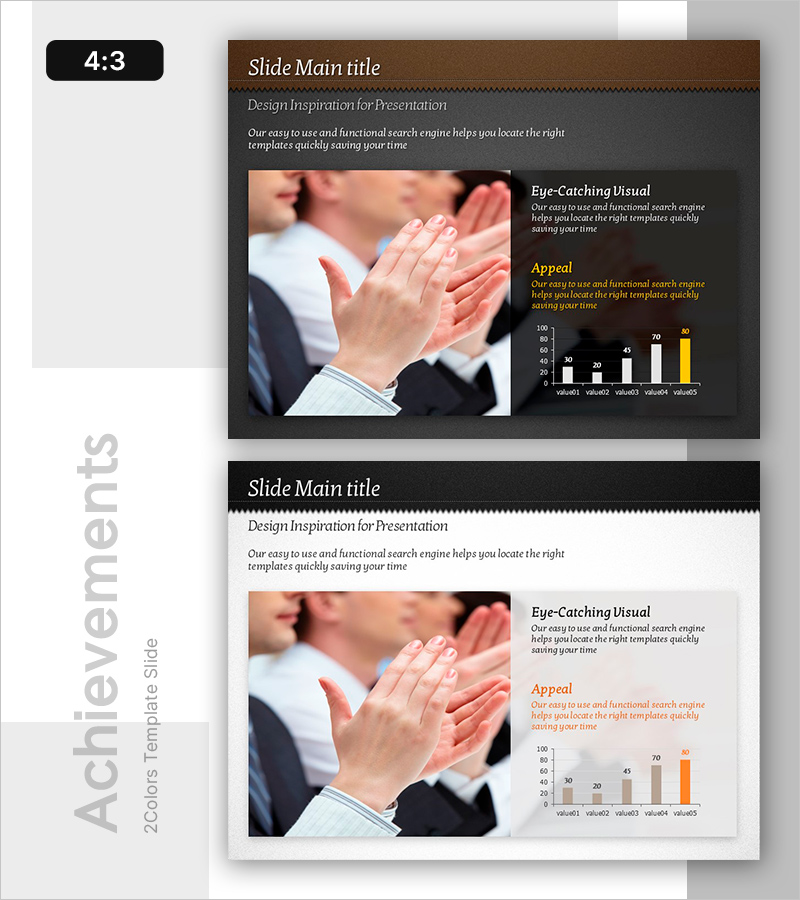
- Slide Ratio 4:3
- Color
Keywords
About the Product
A vertical bar chart PowerPoint slide designed for goal achievement and performance measurement with five data items. Features a dark brown header and charcoal gray background with white, light gray, and gold-colored bars for clear data visualization. Each item (value01 through value05) is compared numerically, with the final item highlighted in gold to emphasize peak performance. The two-slide set includes both dark and light theme versions for flexible use across different presentation contexts. Ideal for business strategy updates, performance reports, goal achievement tracking, and data-driven decision-making presentations.
Usage Points
-
Main Usage
Intuitively compare quantitative data through bar height representation, with gold highlighting to emphasize key performance metrics. Optimized for comparing five data categories such as business performance, sales volume, achievement rates, or departmental results.
-
How to Use
Adjust bar heights to match your data values and replace item labels (value01–value05) with actual category names. Use the dark theme for premium-style reports and the light theme for positive, achievement-focused presentations. Apply the gold accent bar to highlight priority items.
-
Recommended For
Executives, team leads, and project managers presenting performance reports and goal achievement status; marketing teams analyzing campaign results; sales teams comparing quarterly performance; finance teams presenting revenue updates and budget analysis.
-
Slide Structure
Five-item vertical bar chart with numeric labels on each bar. The final item (value05) is highlighted in gold for emphasis. Includes dark theme (brown header, charcoal background) and light theme (white background) versions. Two slides total, 4:3 aspect ratio, PPTX format.
Related Products
-

Travel Competitor Analysis Vertical Bar Graph – Business Strategy
#Business Strategy #Graph #Financial Outlook & Expected Impact
-

Target Performance and Expected Results – Visualized with Vertical Bar Charts
#Business Strategy #Graph #Financial Outlook & Expected Impact
-

Growth Highlight Bar Graph – Revenue Outlook and Expectations
#Business Strategy #Graph #Financial Outlook & Expected Impact
-

Flower Wide PPT Vertical Bar Graph – Performance and Expectations
#Business Strategy #Graph #Financial Outlook & Expected Impact
