Mountain Climbing Goals Market Strategy Vertical Bar Chart
RJ0600060_12
- Last Update 07/06/2025
- File Size 1MB
- # of Slides 2
- File Format PPTX
- Slide Ratio 16:9
- Color
Keywords
- #Content-Based Slides
- #Design-Based Slides
- #Business Strategy
- #Diagram
- #Graph
- #Financial Outlook & Expected Impact
- #Achievements
- #Column
- #Column Chart
- #16:9
- #vertical bar chart PowerPoint
- #column chart slide template
- #5-item comparison chart
- #goal achievement visualization
- #market strategy presentation slide
- #data comparison graph
About the Product
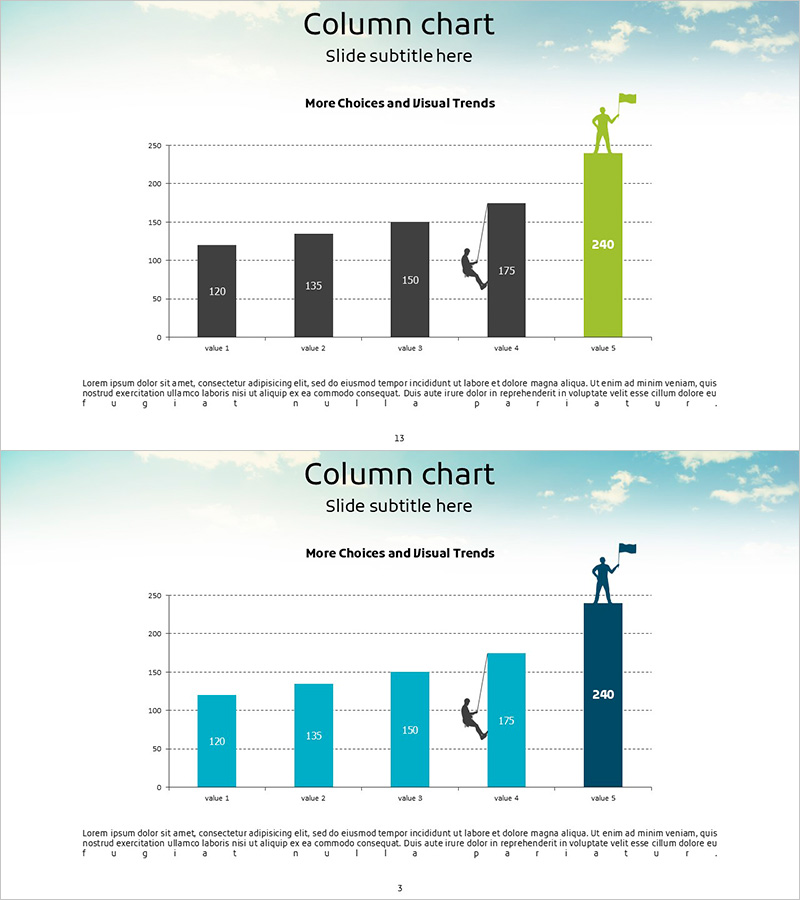
A vertical bar chart PowerPoint slide visualizing mountain climbing goals and market strategy performance. This presentation template compares five data points with clear numerical values, using a two-tone color scheme of gray and lime green to highlight the final achievement. The last bar is emphasized in bright lime green to draw attention to peak performance. Two slide variations are included with different color combinations (gray base and blue base), both optimized for 16:9 widescreen format. Ideal for business performance reports, quarterly results presentations, revenue forecasts, and strategic planning discussions where quantitative data comparison is essential.
Usage Points
-
Main Usage
This slide is designed for presentations requiring quantitative data comparison across multiple items with emphasis on peak performance. The five-item structure allows viewers to quickly understand comparative metrics, while the highlighted final bar effectively communicates achievement or success. Perfect for business performance reports, quarterly comparisons, revenue projections, and strategic outcome presentations.
-
How to Use
Two slide variations are provided with different color schemes—gray-based and blue-based designs. Select the version that best matches your presentation theme and brand colors. Edit the numerical labels, item names, and title to reflect your actual data. The chart structure remains consistent across both slides, allowing you to choose based on your visual preference.
-
Recommended For
Recommended for executives, planning teams, sales departments, and finance teams presenting business performance reports, market analysis, quarterly results, goal achievement metrics, ROI visualization, marketing campaign performance analysis, and strategic planning outcomes.
-
Slide Structure
Two-slide set featuring a vertical bar chart with five data points. The first slide displays four gray bars and one lime green highlight bar. The second slide uses a blue base color with a darker blue emphasis bar. Both slides include numerical value labels, gridlines for reference, and legend information to enhance data readability and professional presentation.
Related Products
-

Tooth Sugar Increase Decrease Diagram – Profitability and Expected Effects
#Business Strategy #Diagram #Graph
-

Vertical Bar Chart for Achieving Goals – Growth and Fulfillment
#Business Strategy #Graph #Financial Outlook & Expected Impact
-

Growth Highlight Bar Graph – Revenue Outlook and Expectations
#Business Strategy #Graph #Financial Outlook & Expected Impact
-

Analysis and Graphs in Future Prediction – Market Strategy and Profitability
#Business Strategy #Market and Competitor Analysis #Diagram
