App Payment Service Market Analysis Graph – Visualizing Market Share
RJ0300010_8
- Last Update 04/20/2025
- File Size 4.1MB
- # of Slides 2
- File Format PPTX
- Slide Ratio 16:9
- Color
Keywords
About the Product
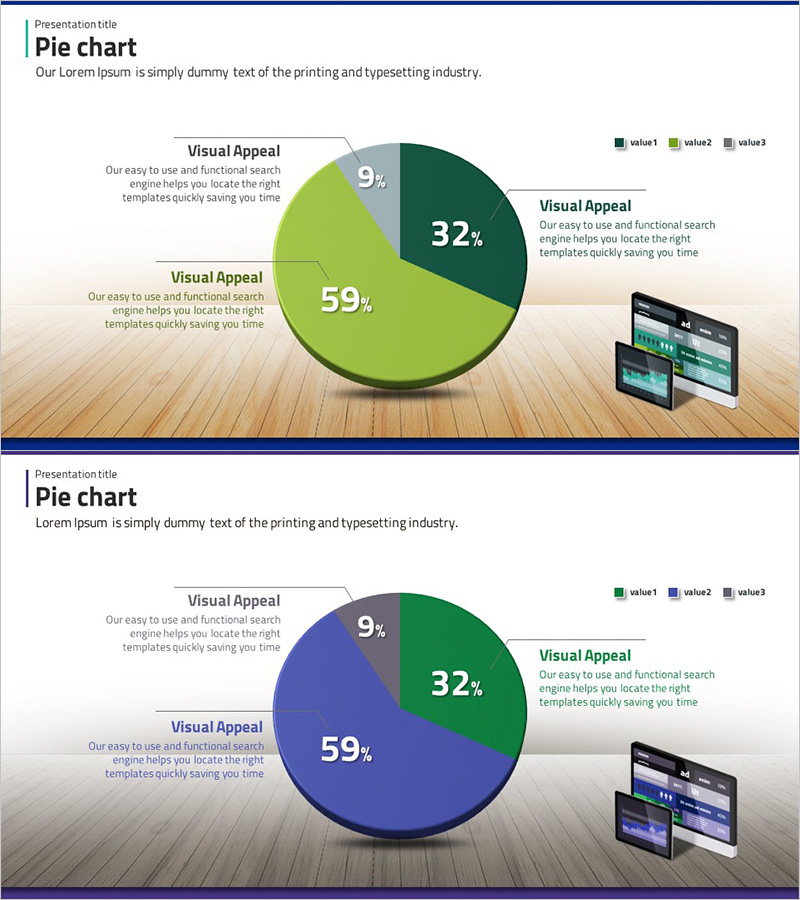
A pie chart PowerPoint slide designed for app payment service market analysis presentations. This slide visualizes market share distribution across three segments at 59%, 32%, and 9% using a 3D circular chart in forest green, lime, and gray tones. Each chart segment includes accompanying text description areas, with device mockup imagery on the right side to enhance presentation completeness. The 2-slide set offers color variations—lime and forest green on the first slide, deep purple and gray on the second—allowing you to match your presentation theme. Fully editable PPTX format for immediate customization.
Usage Points
-
Main Usage
Ideal for app payment services, financial product, and market analysis presentations where you need to compare competitor market share or customer composition across three key segments. The 3D pie chart's visual impact captures audience attention while conveying numerical data intuitively.
-
How to Use
Replace the slide text and percentages with your own data. Modify each segment's percentage values and labels, then update the left-side description text box with your analysis content. Choose between the two color variations to match your presentation's overall tone and branding.
-
Recommended For
Marketing professionals, business analysts, financial institution executives, and startup founders presenting at investor pitches, market analysis reports, and business plan presentations. Particularly effective for comparing three major competitors or customer segments.
-
Slide Structure
2-slide set with each slide featuring a title at top left, a 3D 3-segment pie chart (59%, 32%, 9%) in the center, descriptive text box at bottom left, and device mockup imagery on the right. First slide uses forest green, lime, and gray; second slide features deep purple and gray color scheme.
Related Products
-

Target Market Share Analysis – Visualizing Market Analysis with Pie Chart
#Market and Competitor Analysis #Graph #Other
-

Market Analysis by Year Pie Chart – Emphasizing Market Share
#Market and Competitor Analysis #Graph #Market Share
-

A Lively Green Orange Pie Chart
#Market and Competitor Analysis #Graph #Market Share
-

Analysis by Pie Chart Item – Visualizing Market Share
#Market and Competitor Analysis #Graph #Market Share
