Problem and Opportunity Analysis with Pie Charts
RJ0400077_4
- Last Update 06/07/2025
- File Size 2.6MB
- # of Slides 2
- File Format PPTX
- Slide Ratio 16:9
- Color
Keywords
- #Content-Based Slides
- #Design-Based Slides
- #Market and Competitor Analysis
- #Graph
- #Text Box
- #Market Share
- #Market Analysis
- #Circles
- #Pie Chart
- #Speech Bubble
- #16:9
- #pie chart PowerPoint slide
- #problem opportunity analysis presentation
- #two-segment pie graph
- #market analysis slide template
- #competitive analysis deck
About the Product
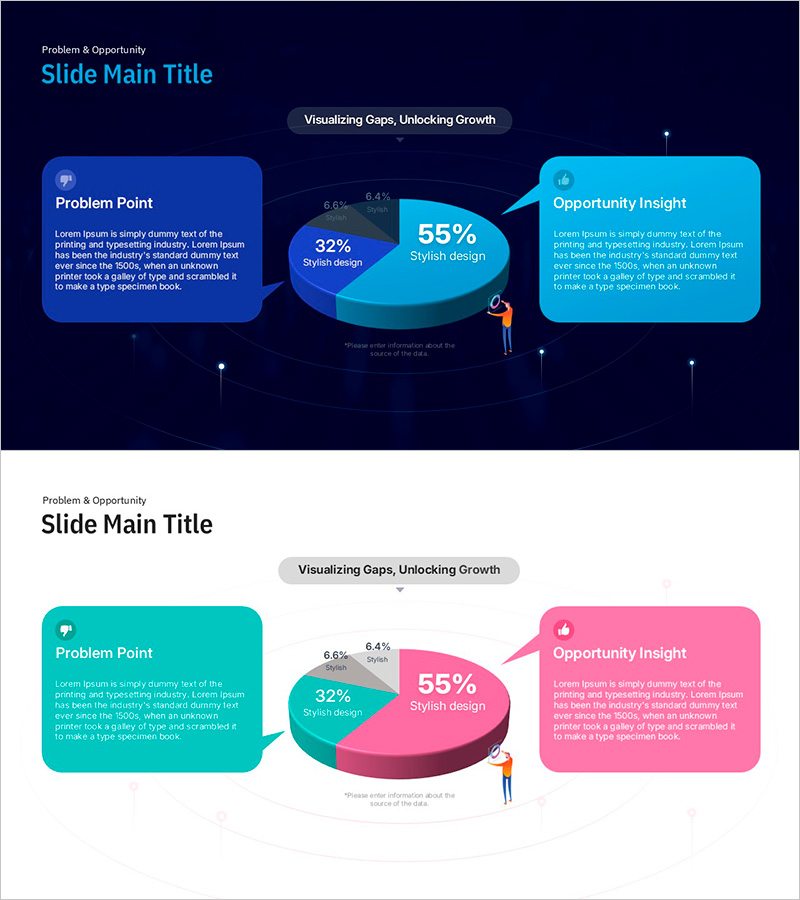
A two-segment pie chart PowerPoint slide for visually comparing problem points and opportunities side by side. Built on a dark blue background with cyan and pink dual-tone pie charts and left-right text box layout, this presentation slide clearly expresses each section's percentage ratio. Ideal for market analysis, competitive analysis, and strategy presentations where you need to communicate current situation assessment and improvement opportunities simultaneously. Comes in 16:9 widescreen format with 2 slides, ready for immediate editing.
Usage Points
-
Main Usage
Visualizes current situation's problem points and improvement opportunities through pie chart ratios to support strategic decision-making. Left-right contrast structure with Problem Point and Opportunity Insight allows balanced presentation of both perspectives.
-
How to Use
Use as a current situation assessment section in market analysis, competitive analysis, and business diagnostic presentations. Replace pie chart percentages with actual data and edit text box descriptions with specific content for immediate presentation use.
-
Recommended For
Ideal for strategy planning teams, marketing departments, and executive briefings. Effective for business situation diagnostics, new project proposals, investment pitch decks, and consulting reports where communicating both problem recognition and solution direction is essential.
-
Slide Structure
2-slide set. Slide 1 features dark blue background with left blue text box (Problem Point), center two-segment pie chart (32% vs 55%), and right cyan text box (Opportunity Insight). Slide 2 uses light background with identical structure in cyan and pink dual tones, providing color variation options.
Related Products
-

Male and Female Real Estate Holding Status Graph – Market Share at a Glance
#Market and Competitor Analysis #Graph #Market Share
-

Share Analysis of Two Topics with Pie Chart
#Market and Competitor Analysis #Diagram #Graph
-

Kids’ Study Time Planner – Market Share Visualization
#Market and Competitor Analysis #Graph #Market Share
-

Market Analysis Report Visualized with Pie Chart
#Market and Competitor Analysis #Diagram #Graph
