Market Share Comparison Pie Chart – Market Analysis
RJ0300009_22
- Last Update 04/20/2025
- File Size 0.1MB
- # of Slides 2
- File Format PPTX
- Slide Ratio 16:9
- Color
Keywords
About the Product
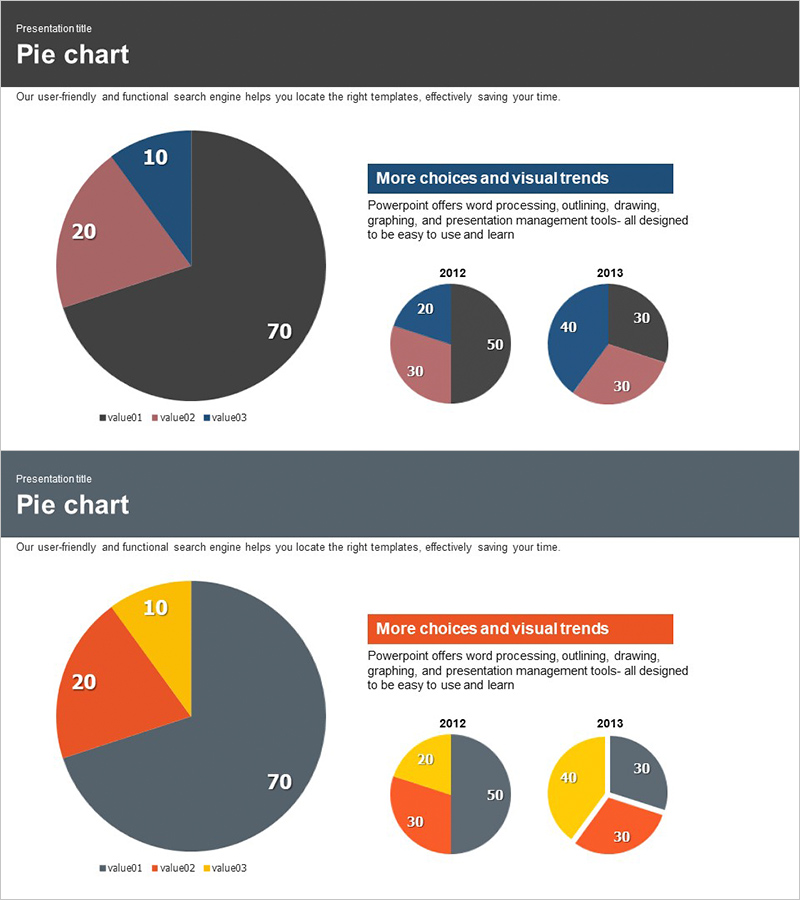
This free pie chart PowerPoint slide is designed to visualize market share and ratio data at a glance. The layout features a large pie chart on the left displaying three data segments (70%, 20%, 10%), paired with two smaller comparison pie charts on the right labeled by year (2012 and 2013), enabling clear time-series analysis within a single presentation slide. Two color variants are included: a dark gray, rose pink, and navy blue scheme, and a dark gray, orange-red, and yellow scheme, giving you flexibility to match your brand or presentation tone. Simply replace the values, legends, and year labels with your actual data to instantly embed this slide into market analysis reports, competitive landscape decks, business plan presentations, or investor pitch decks. For more free graph slides and chart templates, explore GoodPello's free graph section.
Usage Points
-
Main Usage
Designed to visually communicate market share distribution, competitive ratios, and year-over-year data changes using pie charts, making proportional data immediately clear to any audience.
-
How to Use
Replace the percentage values and legend labels (value01–03) with your actual data, update the year labels on the smaller comparison charts, and insert the slide into the market analysis or competitive landscape section of your presentation.
-
Recommended For
Ideal for marketers preparing market analysis reports, startup founders building investor pitch decks with market share data, and business planners who need a clean ratio visualization slide for proposals or business plans.
-
Slide Structure
Single-slide layout. Left side: large pie chart with 3 data segments. Right side: highlighted text box area and two small year-comparison pie charts (2012 and 2013). Includes 2 color variants: dark gray/rose pink/navy and dark gray/orange-red/yellow.
Related Products
-

Vertical Bar Chart Visualizing Candidate Values – Trends and Choices
#Free Graphs
-

Competitive Advantage Bar General Graph – Emphasizing Performance through Market Analysis
#Free Graphs
-

Market Analysis Graph – Harmony of Pink and Bluegreen
#Free Graphs
-

Comparative Analysis Bar Graph – Market and Competitor Analysis
#Free Graphs
