Market Analysis Broken Line Graph – Visualizing Business Performance
RJ0300009_19
- Last Update 04/20/2025
- File Size 0.2MB
- # of Slides 2
- File Format PPTX
- Slide Ratio 16:9
- Color
Keywords
- #Content-Based Slides
- #Design-Based Slides
- #Business Strategy
- #Market and Competitor Analysis
- #Graph
- #Achievements
- #Market Status
- #Line
- #Line Chart
- #16:9
- #line chart PowerPoint slide
- #trend analysis presentation template
- #market analysis graph
- #business performance visualization
- #broken line chart download
About the Product
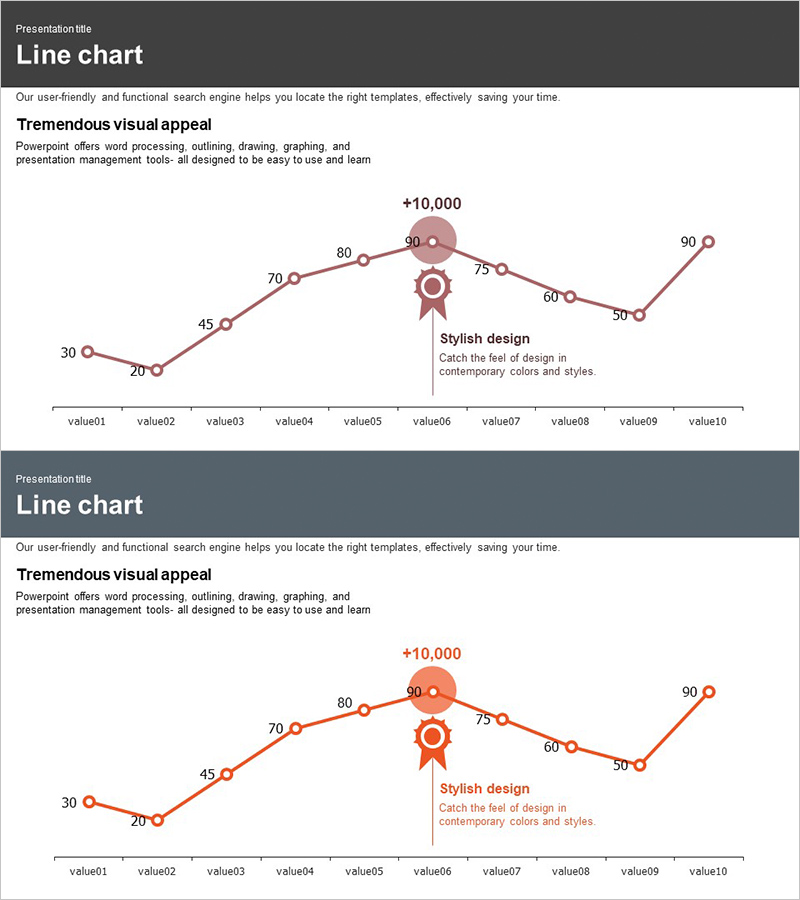
A line chart PowerPoint slide designed to visualize market trends and business performance metrics. The slide features a burgundy-colored trend line connecting 10 data points, with a diamond-shaped marker and ribbon icon highlighting the peak value. Numerical labels appear above each point, enabling clear communication of market fluctuations and performance comparisons. Delivered as a 2-slide PPTX file in 16:9 aspect ratio, fully editable and ready for business reports, marketing presentations, and investor pitch decks.
Usage Points
-
Main Usage
Communicate time-series data such as market analysis, business performance, sales trends, and competitive benchmarking through a line graph that clearly shows upward, downward, and fluctuating patterns. The peak marker visually emphasizes key achievement milestones.
-
How to Use
Open the slide and replace the sample data points (30–90) and labels (value01–value10) with your actual figures. Reposition the diamond marker and ribbon icon to your peak value location, and adjust the color scheme to match your corporate branding guidelines.
-
Recommended For
Marketing managers, business planners, financial analysts, and sales directors presenting quarterly or annual performance reports, market share evolution, customer satisfaction trends, revenue growth rates, and competitive positioning to executives, investors, and team members.
-
Slide Structure
2-slide set. Slide 1: burgundy line chart with 10 connected data points, numerical labels at each point, diamond marker and ribbon icon at peak (value 90), and legend bar at bottom (value01–value10). Slide 2: identical structure in orange-toned color variant for alternative design option.
Related Products
-

Origami Line Chart Slide - Visualizing Business Performance
#Business Strategy #Market and Competitor Analysis #Graph
-

Infographic Slide Visualizing App Market Sales Trends
#Business Strategy #Market and Competitor Analysis #Graph
-

Curve Graph of a Meal – Business Strategy
#Business Strategy #Market and Competitor Analysis #Graph
-

Building Trends Line Chart – Visual Tool for Performance Analysis
#Business Strategy #Market and Competitor Analysis #Graph
