Market Status Chart Analysis – Data-Driven Insights
RJ0800050_12
- Last Update 08/14/2025
- File Size 0.3MB
- # of Slides 2
- File Format PPTX
- Slide Ratio 16:9
- Color
Keywords
- #Content-Based Slides
- #Design-Based Slides
- #Business Strategy
- #Market and Competitor Analysis
- #Graph
- #Achievements
- #Market Status
- #Circles
- #Line
- #Doughnut Chart
- #Line Chart
- #16:9
- #line chart PowerPoint slide
- #trend analysis presentation template
- #market data visualization
- #business analytics graph
- #multi-series chart download
About the Product
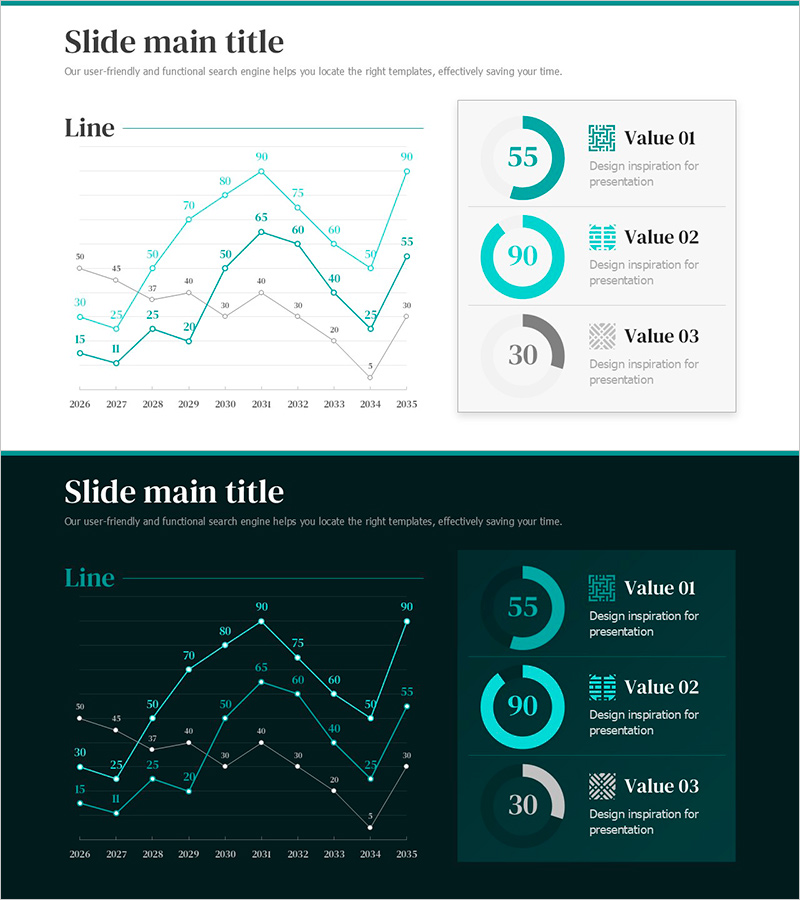
A comprehensive PowerPoint slide featuring a multi-series line chart tracking market data from 2026 to 2035 across three data series. The teal primary line and gray secondary lines clearly visualize numerical trends and performance changes over time. The right side displays three donut charts (55, 90, 30) paired with icon-labeled value boxes to present quantitative metrics and strategic insights simultaneously. This 16:9 widescreen 2-slide template is fully editable and ready for immediate use in business presentations.
Usage Points
-
Main Usage
Display temporal data trends such as market conditions, sales performance, and KPIs using multi-series line charts, while simultaneously highlighting critical metrics through donut chart visualization. Ideal for executive reports, business plans, investor presentations, and data-driven strategic decision-making.
-
How to Use
Input your year-by-year performance data into the left line chart and update the donut chart values on the right with your key metrics. Customize series colors to match your corporate branding, modify data labels, and adjust text descriptions and icons to fit your presentation context. All chart elements are fully editable.
-
Recommended For
Finance teams presenting quarterly earnings reports, marketing teams analyzing campaign performance, sales teams tracking goal achievement, executive strategy meetings, investor relations presentations, and consulting firms delivering client analysis reports.
-
Slide Structure
Slide 1: Title area + 3-series line chart (2026–2035 timeline, 50–90 value range) + right panel with three donut charts (Value 01–03) and icon-labeled information boxes. Slide 2: Identical layout with dark background theme. All chart axes, data points, legends, and text elements are fully editable.
Related Products
-

Sewing Graph Chart – Market Status and Performance Analysis
#Business Strategy #Market and Competitor Analysis #Diagram
-

Market Analysis Broken Line Graph – Visualizing Business Performance
#Business Strategy #Market and Competitor Analysis #Graph
-

Curve Graph of a Meal – Business Strategy
#Business Strategy #Market and Competitor Analysis #Graph
-

Origami Line Chart Slide - Visualizing Business Performance
#Business Strategy #Market and Competitor Analysis #Graph
