Income Statement Table – Essential Tool for Financial Analysis
RJ0300009_14
- Last Update 04/20/2025
- File Size 0.1MB
- # of Slides 2
- File Format PPTX
- Slide Ratio 16:9
- Color
Keywords
About the Product
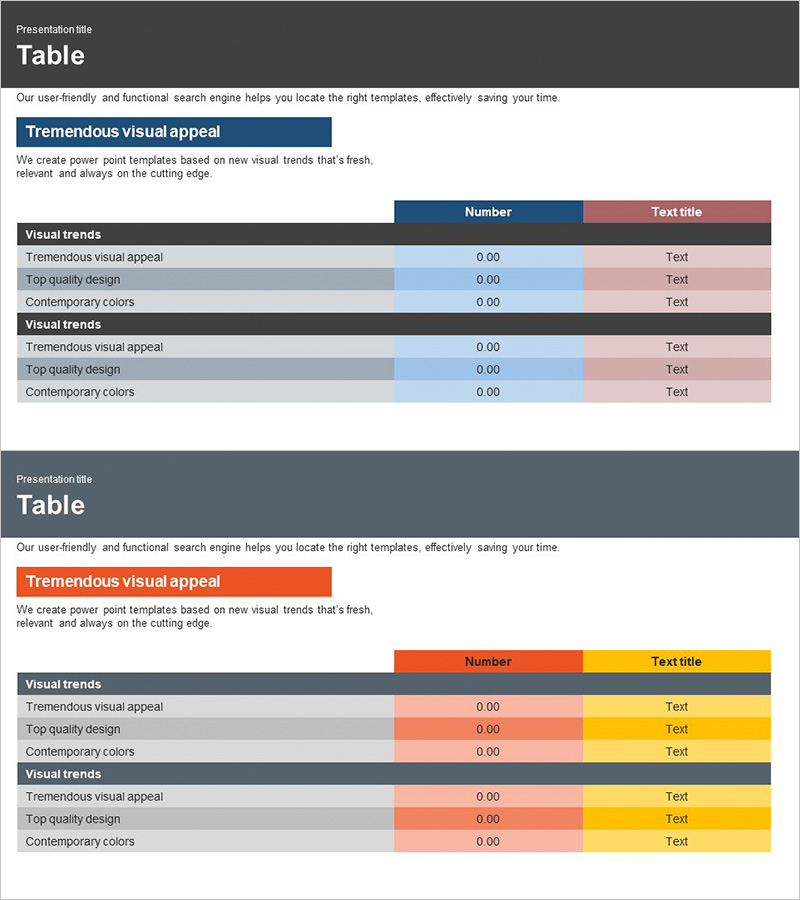
A 2-slide table set for organizing financial data systematically in PowerPoint presentations. Features an income statement format with clear column separation between numerical values and text labels, using dark headers and light backgrounds to emphasize information hierarchy. Ideal for financial reports, business plans, and investor presentations. Provided in 16:9 widescreen PPTX format optimized for modern presentation environments.
Usage Points
-
Main Usage
Presents financial data and numerical values in a structured table format to visualize income statements, financial analysis, and budget status. Dark header rows and light data backgrounds create visual contrast that emphasizes information hierarchy and captures audience attention.
-
How to Use
Use in the financial section of business reports, business plans, and investor presentations to display income statements, financial status, and budget comparisons. Edit numbers and labels directly in PowerPoint to input actual financial data.
-
Recommended For
Recommended for CFOs, finance managers, executives, investor relations specialists, and accountants who need to communicate financial information. Particularly useful for quarterly financial reviews, annual reports, and investment pitch presentations.
-
Slide Structure
2-slide set with each slide containing a table structure of 2 columns (Number and Text title) and 3 rows (2 Visual trends sections plus additional data row). Dark header row and light data rows create clear information priority and visual separation.
Related Products
-

Business Income Statement Slide – Table for Financial Clarity
#Financial Plans and Performance #Diagram #Income Statement
-

Business Sales and Profit Calculation Table – Essential Slide for Financial Planning
#Financial Plans and Performance #Diagram #Income Statement
-

Business Income Statement – Visualizing Financial Performance
#Financial Plans and Performance #Diagram #Income Statement
-

Income Statement Table for Financial Visualization – Distinct Data Analysis
#Financial Plans and Performance #Diagram #Income Statement
