Segmented Vertical Bar Chart Template for Analyzing Car Sales
RJ0200057_20
- Last Update 04/14/2025
- File Size 0.2MB
- # of Slides 2
- File Format PPTX
- Slide Ratio 16:9
- Color
Keywords
- #Content-Based Slides
- #Design-Based Slides
- #Market and Competitor Analysis
- #Marketing Plan and Strategy
- #Graph
- #Market Status
- #Distribution Strategy
- #Column
- #Segmented Column
- #16:9
- #segmented vertical bar chart PowerPoint
- #stacked bar graph template
- #car sales analysis slide
- #3-series data visualization
- #marketing chart PowerPoint download
About the Product
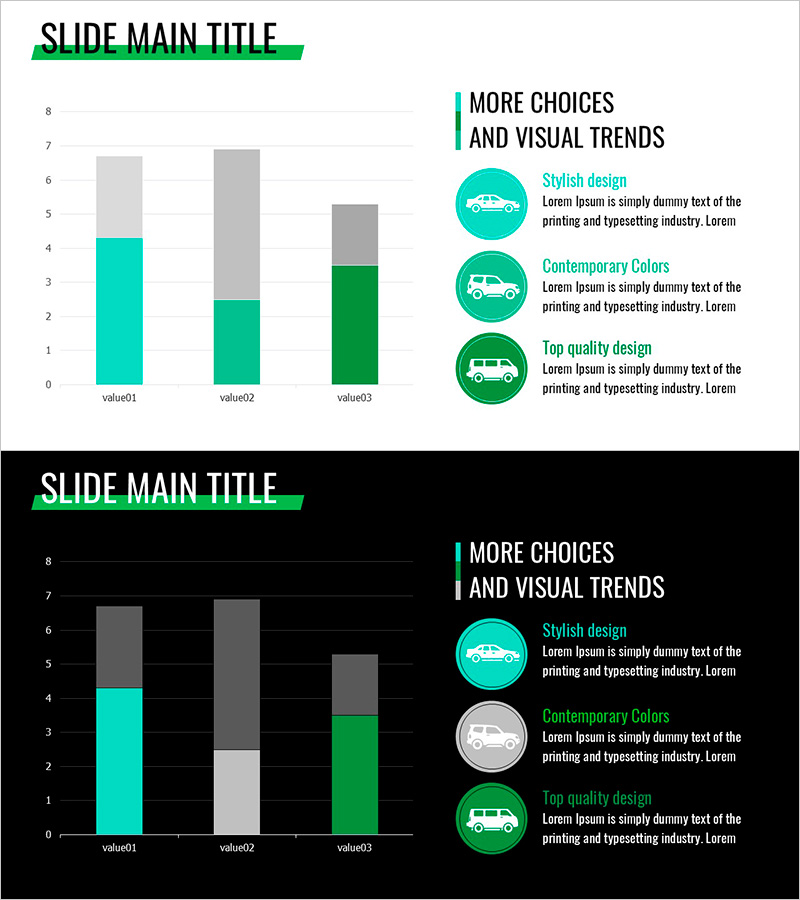
A segmented vertical bar chart PowerPoint slide designed for analyzing car sales performance and market trends. The stacked bar graph displays three data series in teal, gray, and green tones, enabling clear comparison of value01, value02, and value03 across multiple categories. Ideal for presenting multi-layered sales data, market share analysis, and competitive positioning in automotive industry presentations. Fully editable PPTX format with ready-to-use layout and color scheme.
Usage Points
-
Main Usage
Visualize multi-layered automotive sales data, market share distribution, and brand-level performance metrics using a stacked bar chart format. Perfect for marketing strategy presentations, sales reports, and competitive market analysis where comparing three data series simultaneously is essential.
-
How to Use
Each colored segment (teal, gray, green) represents a different data series. Include a legend to clarify which segment corresponds to which category. Replace value01, value02, value03 with actual labels (e.g., Brand A, Brand B, Brand C) and adjust bar heights to match your dataset.
-
Recommended For
Automotive marketing teams, sales departments, executive presentations, market research firms, automotive dealership performance reports, and consulting companies conducting industry analysis and competitive benchmarking.
-
Slide Structure
2-slide set. Slide 1: Light background with 3-series stacked vertical bar chart, three circular car icons on the right with descriptive text. Slide 2: Dark background (black) version of the same chart structure for contrast and visual variety in presentations.
Related Products
-

Origami Presentation Template Section Vertical Bar Graph – Strategic Business Drive
#Business Strategy #Market and Competitor Analysis #Graph
-

Trade Business Analysis Graph – Visualizing Market Status
#Market and Competitor Analysis #Graph #Market Status
-

Blue Pink Market Analysis Segmented Vertical Bar Graph
#Market and Competitor Analysis #Graph #Market Status
-

Blue Line Wide Template Vertical Bar Chart – Market Status Analysis
#Market and Competitor Analysis #Graph #Market Status
