Grey Comparison Donut Chart – Market Status Analysis
RJ0300007_7
- Last Update 04/20/2025
- File Size 0.2MB
- # of Slides 2
- File Format PPTX
- Slide Ratio 16:9
- Color
Keywords
About the Product
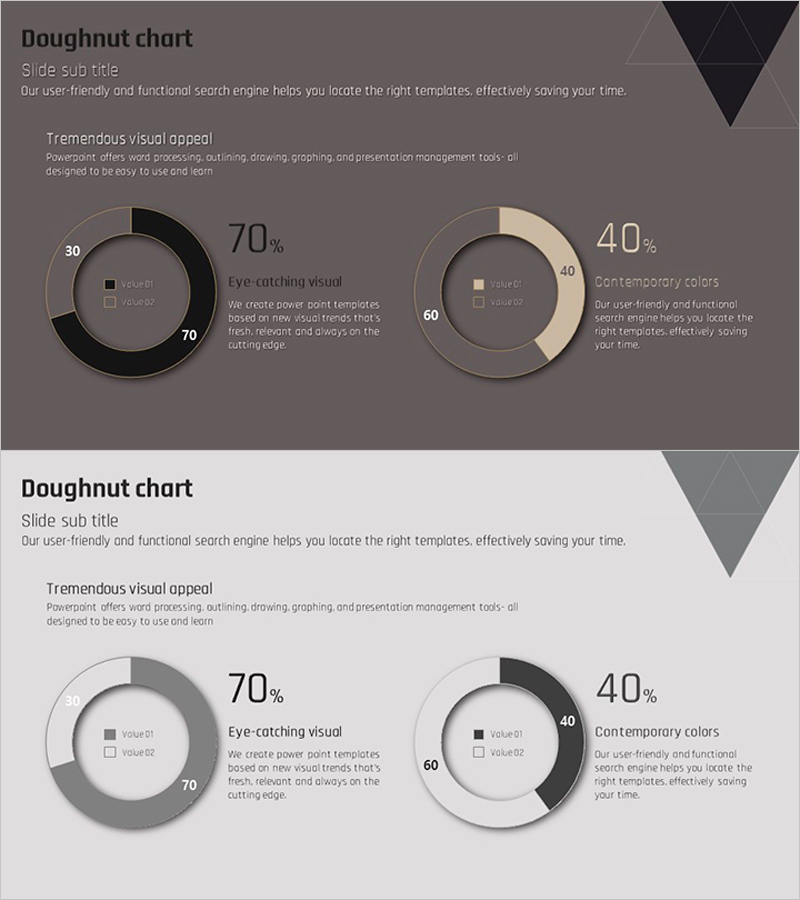
A professional donut chart PowerPoint slide designed for market analysis and competitive comparison presentations. Features two donut graphs in black and beige tones on a grey background, each displaying key metrics (70% and 40%) prominently in the center. This 16:9 widescreen slide set includes 2 layouts with integrated legend and descriptive text areas for clear data interpretation. Ideal for visualizing market share, customer satisfaction scores, performance metrics, and comparative business indicators. Ready-to-edit PPTX format enables immediate use in executive reports, strategic presentations, and business analysis decks.
Usage Points
-
Main Usage
Simultaneously display two comparative datasets using donut graphs to enhance data credibility in presentations. Central percentage emphasis delivers key messages instantly, while grey tone color scheme establishes a professional and neutral presentation atmosphere.
-
How to Use
Apply to executive reports, market analysis presentations, and business plan decks in the data visualization section. Edit legends and descriptive text to match your data, update donut graph percentages, and deploy immediately as presentation slides.
-
Recommended For
Marketing managers, business analysts, business development professionals, and consultants who support data-driven decision-making. Particularly effective for quarterly performance reports, competitive analysis, and customer satisfaction survey result presentations.
-
Slide Structure
Slide 1: Grey background + title + descriptive text + black donut graph (70% emphasis) + beige donut graph (40% emphasis) + 2 legends. Slide 2: Light grey background variant with identical layout. Each donut divides into 2 series with centered percentage and value labels maximizing data readability.
Related Products
-

Country's Representative Food – Market Share Analysis
#Market and Competitor Analysis #Graph #Market Status
-

Smoking Rates among Lung Cancer Patients – Market Analysis
#Market and Competitor Analysis #Graph #Market Status
-

Leaf Illustration Donut Chart - Visualizing Market Share
#Market and Competitor Analysis #Graph #Market Status
-

Donut Chart for Components and Market Share Visualization – Market Analysis
#Market and Competitor Analysis #Graph #Market Status
