Country's Representative Food – Market Share Analysis
RJ0800051_7
- Last Update 08/15/2025
- File Size 0.9MB
- # of Slides 2
- File Format PPTX
- Slide Ratio 16:9
- Color
Keywords
About the Product
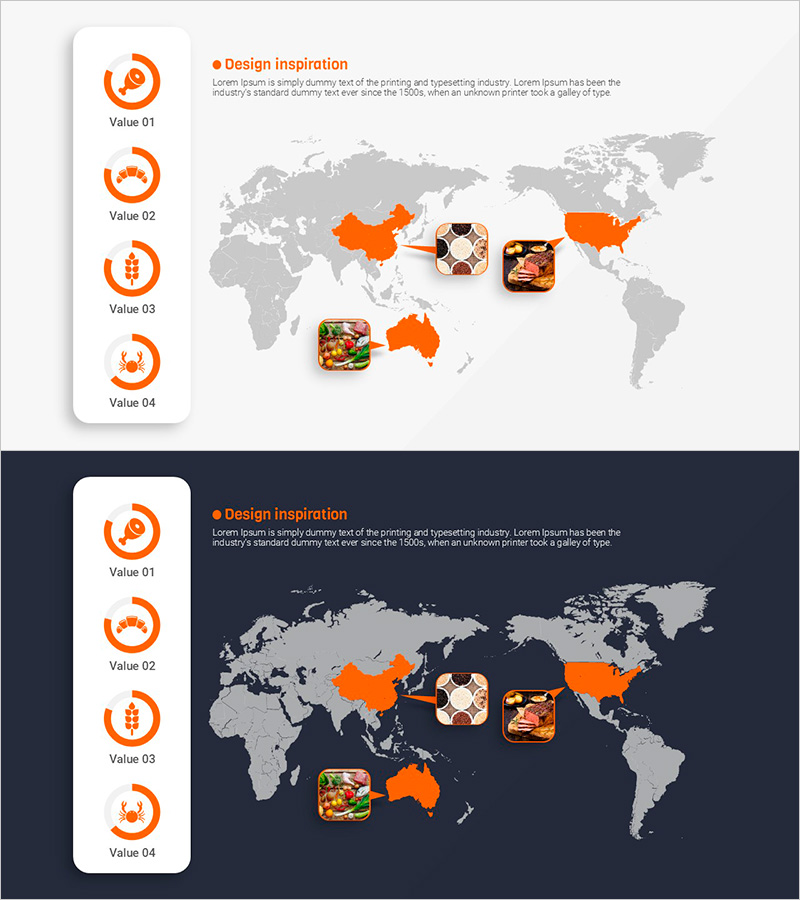
A PowerPoint slide featuring a donut chart that visualizes market share distribution across major countries' representative foods. The design combines orange accent colors with a gray world map background to present global market analysis data intuitively. This 2-slide set is ready to use for various market analysis presentations. Each country's food image is paired with proportion information, making it effective for business strategy development and market trend explanations.
Usage Points
-
Main Usage
Clearly visualize market share, sales ratios, and consumption composition across major countries using a donut chart format. Optimized for business strategy presentations, market analysis reports, and investor pitch decks where global data needs intuitive visual communication.
-
How to Use
Input your actual numerical data into the donut chart segments shown on the slide, and replace country-specific images with your own market data. Use the left-side icon list to organize item-by-item explanations systematically.
-
Recommended For
Marketing professionals, business analysts, executives preparing reports, food and beverage industry specialists, and global market research teams explaining market share and consumption trends.
-
Slide Structure
2-slide set with light background version featuring a 4-segment donut chart, vertical icon list (Value 01-04) on the left, and country food images positioned on a world map on the right. Second slide provides the same layout with dark background option.
Related Products
-

Marking Milestones with Market Data – Market Status and Share
#Market and Competitor Analysis #Graph #Market Status
-

Logistics Market Share Chart – Current Status and Competitive Analysis
#Market and Competitor Analysis #Graph #Market Status
-

Enrollment Stats & Ratios Donut Chart
#Market and Competitor Analysis #Graph #Market Status
-

Visualizing Value Ratios with Pie Charts – Essential Presentation Template
#Market and Competitor Analysis #Diagram #Graph
