Leaf Illustration Donut Chart - Visualizing Market Share
RJ0600109_20
- Last Update 07/20/2025
- File Size 0.2MB
- # of Slides 2
- File Format PPTX
- Slide Ratio 16:9
- Color
Keywords
- #Content-Based Slides
- #Design-Based Slides
- #Market and Competitor Analysis
- #Graph
- #Market Status
- #Market Share
- #Circles
- #Doughnut Chart
- #16:9
- #donut chart PowerPoint
- #pie chart slide template
- #market share visualization
- #ratio chart template
- #circular graph presentation
- #PowerPoint chart slide design
About the Product
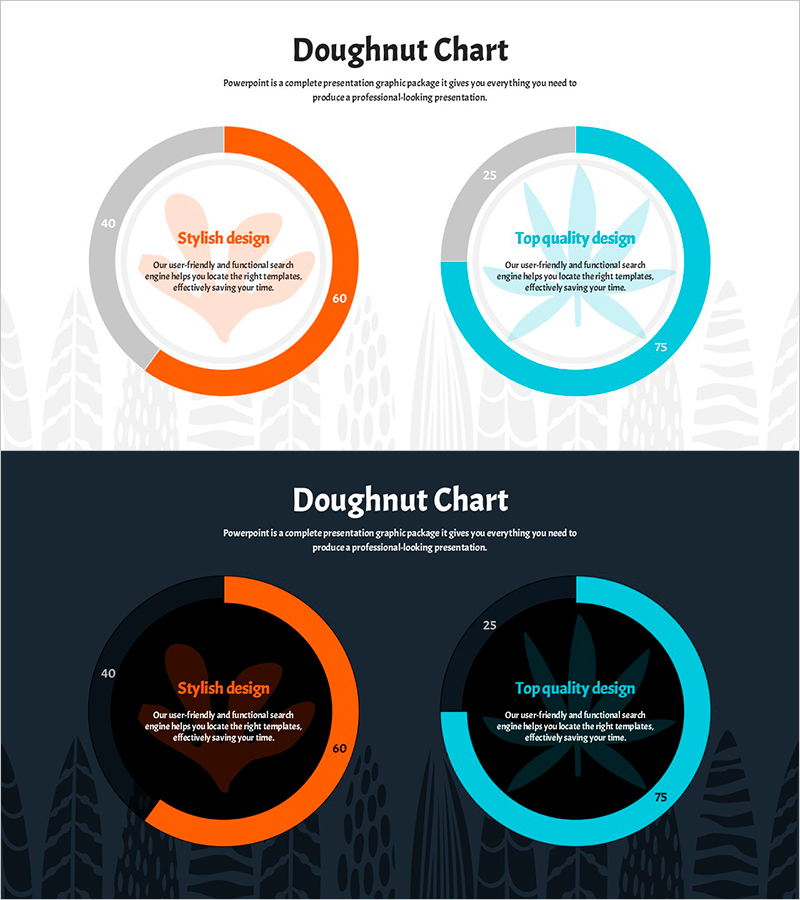
A professional donut chart PowerPoint slide optimized for market analysis and competitive comparison. The circular graph features two data series in orange and cyan colors, ideal for visualizing market share, sales distribution, customer satisfaction ratios, and segment composition. The center circular area accommodates key messages or numerical values, while the outer ring displays percentages and legends. Two design versions are included—light background for daytime presentations and dark background for evening or projector environments. The 2-slide set is formatted in 16:9 widescreen ratio with fully editable elements.
Usage Points
-
Main Usage
Donut charts excel at emphasizing part-to-whole relationships and proportional data. Ideal for displaying market share, sales composition, customer segment distribution, product category revenue breakdown, and comparative ratios across 2–4 categories. The center area highlights key metrics or brand messaging, drawing viewer attention to critical insights.
-
How to Use
Input your actual data values into the donut ring segments and add key messages or icons to the center circular area. Use the light background version for daytime presentations and printed materials; select the dark background for evening events or projector-based environments. All colors, percentages, and text are fully customizable in PowerPoint.
-
Recommended For
Ideal for marketing strategy presentations, business analysis reports, investor pitch decks, sales performance reviews, market research findings, and quarterly business updates. Recommended for executives, marketing managers, sales teams, management consultants, data analysts, and business strategists presenting ratio-based insights.
-
Slide Structure
2-slide set featuring two donut charts per slide in left-right layout. Each chart comprises three layers: outer colored ring (orange or cyan), middle gray background ring, and center white or black circular area. Legend and descriptive text fields are positioned adjacent to each chart for context and data labeling.
Related Products
-

Distribution Graph of Food Materials – Market Status Chart
#Market and Competitor Analysis #Graph #Other
-

Market Share Analysis with Donut Chart – In-depth Understanding of Market and Competitors
#Market and Competitor Analysis #Graph #Market Status
-

Enrollment Stats & Ratios Donut Chart
#Market and Competitor Analysis #Graph #Market Status
-

Visualizing Value Ratios with Pie Charts – Essential Presentation Template
#Market and Competitor Analysis #Diagram #Graph
