Donut Chart for Components and Market Share Visualization – Market Analysis
RJ0800039_10
- Last Update 08/10/2025
- File Size 0.5MB
- # of Slides 2
- File Format PPTX
- Slide Ratio 16:9
- Color
Keywords
About the Product
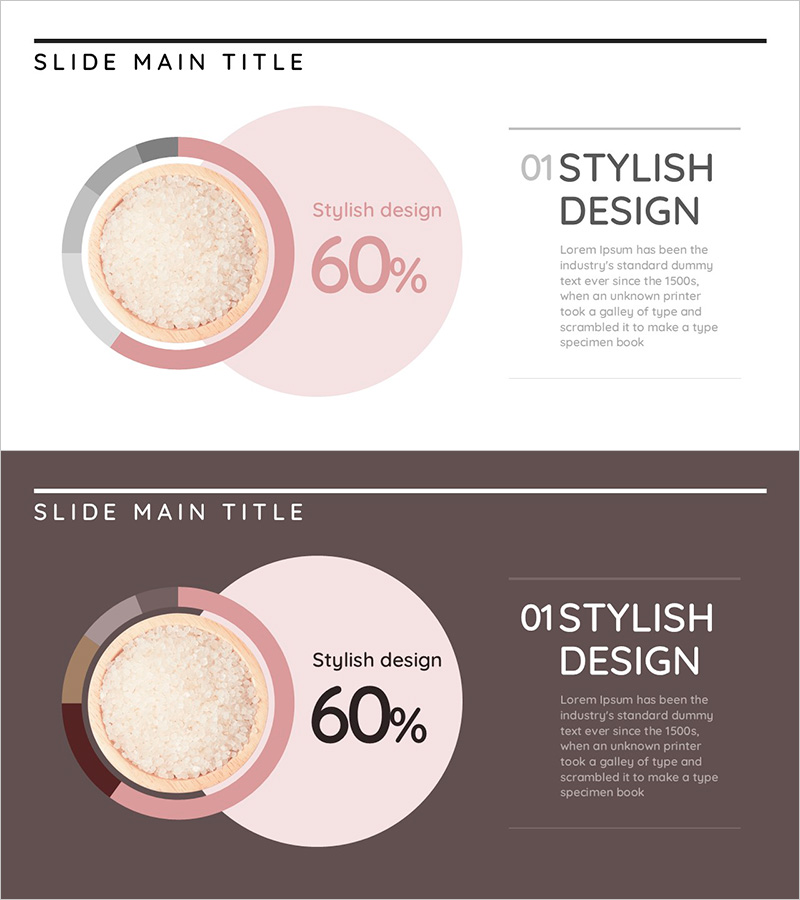
A 2-slide donut chart PowerPoint presentation for visualizing market share and component composition. The soft color palette of pink, gray, and beige clearly represents data, with a central circular area highlighting key metrics (60%). Each slide includes a title section and descriptive text space, ready for immediate use in presentations, reports, and analytical materials. Available in 16:9 widescreen PPTX format, fully editable in all presentation software.
Usage Points
-
Main Usage
Intuitively express market share, sales composition, customer distribution, and product category proportions relative to the whole. The central circular area emphasizes key metrics, building data credibility in business analysis, marketing reports, and investor presentations.
-
How to Use
Input actual data into the donut chart area on each slide and write analysis content in the right text section. Add a title, legend, and numerical labels so the audience understands at a glance. Colors and fonts are fully customizable to match your corporate brand.
-
Recommended For
Marketing professionals presenting market analysis, finance teams reporting sales composition, executives explaining quarterly performance, product planning teams analyzing customer segmentation, and consulting firms presenting industry analysis. Ideal for any business presentation where ratio comparison is critical.
-
Slide Structure
2-slide layout. Each slide features a title area (SLIDE MAIN TITLE) at the top, a donut chart on the left (4-segment structure with 60% metric in center), and a text section on the right (title and description). Includes white background and dark background versions with pink, gray, and beige segments for diverse presentation environments.
Related Products
-

Marking Milestones with Market Data – Market Status and Share
#Market and Competitor Analysis #Graph #Market Status
-

Distribution Graph of Food Materials – Market Status Chart
#Market and Competitor Analysis #Graph #Other
-

Market Share Analysis Graph by Technology – Competition and Collaboration
#Market and Competitor Analysis #Diagram #Graph
-

Logistics Market Share Chart – Current Status and Competitive Analysis
#Market and Competitor Analysis #Graph #Market Status
