Smoking Rates among Lung Cancer Patients – Market Analysis
RJ0800019_6
- Last Update 08/05/2025
- File Size 3.6MB
- # of Slides 2
- File Format PPTX
- Slide Ratio 16:9
- Color
Keywords
About the Product
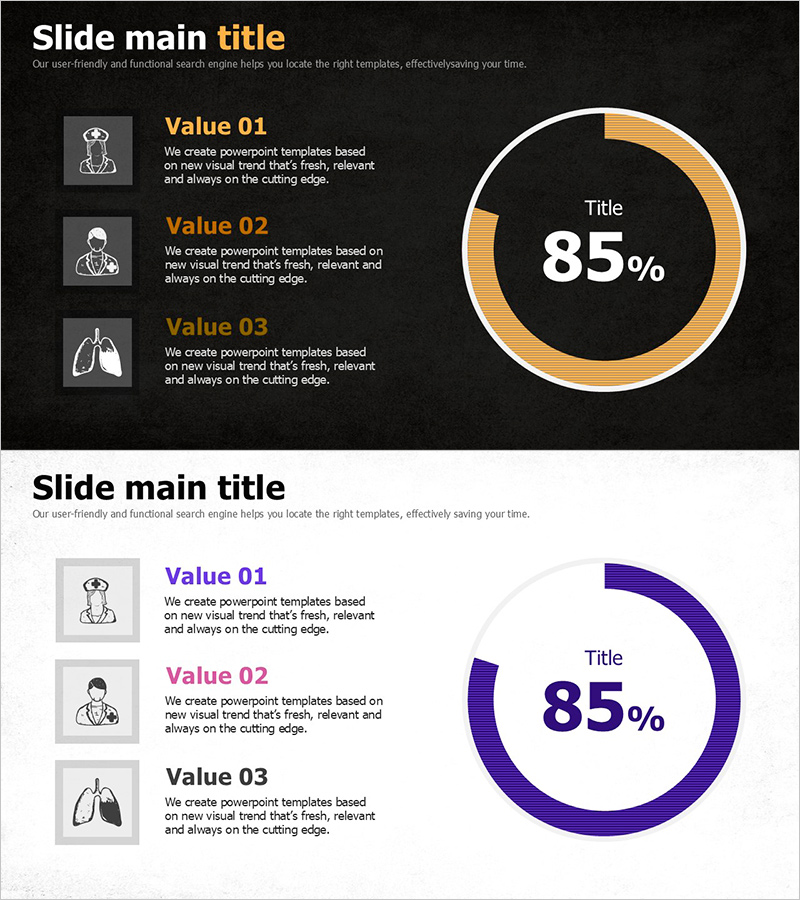
A 2-slide PowerPoint set featuring donut charts for displaying proportions and composition data. Includes one slide with a black background, gold-toned donut chart, and white typography, plus a second slide with a light background and deep purple donut visualization. Both slides feature a left-side layout with 3 icon-based text areas for highlighting key value points. Delivered in 16:9 widescreen PPTX format, fully editable and ready for market analysis, statistical reports, performance presentations, and business communications.
Usage Points
-
Main Usage
Clearly visualizes proportions and percentages using donut chart design. Effectively communicates market share, statistical data, achievement rates, and composition breakdowns. The left-side 3-item text area supports data interpretation by providing context, insights, or supplementary information alongside the visual representation.
-
How to Use
Use the black background slide for professional, high-impact presentations and the light background slide for accessible, clear communication. Edit the donut chart percentage, colors, and labels to reflect your actual data. Populate the left text areas with analysis, key findings, or supporting details to complete the slide.
-
Recommended For
Financial reports, market analysis presentations, performance reviews, data-driven proposals, business status updates, and marketing analytics. Ideal for executives, analysts, marketing professionals, consultants, and anyone presenting quantitative insights to stakeholders.
-
Slide Structure
2-slide layout. Slide 1: Black background with gold donut chart (85% display), white title and percentage text, left sidebar with 3 icons and text fields (Value 01–03). Slide 2: Light background with deep purple donut chart and matching left-side 3-item layout. 16:9 widescreen, PPTX format.
Related Products
-

Market Share Analysis with Donut Chart – In-depth Understanding of Market and Competitors
#Market and Competitor Analysis #Graph #Market Status
-

Market Share Analysis Graph by Technology – Competition and Collaboration
#Market and Competitor Analysis #Diagram #Graph
-

Logistics Market Share Chart – Current Status and Competitive Analysis
#Market and Competitor Analysis #Graph #Market Status
-

Visualizing Fish Market Share with Doughnut Chart – Vitality of the Ocean
#Market and Competitor Analysis #Graph #Market Status
