Mint Green Curved Line Trend - Revenue Forecast and Expectations
RJ0600088_24
- Last Update 07/14/2025
- File Size 0.4MB
- # of Slides 2
- File Format PPTX
- Slide Ratio 16:9
- Color
Keywords
- #Content-Based Slides
- #Design-Based Slides
- #Business Strategy
- #Market and Competitor Analysis
- #Graph
- #Financial Outlook & Expected Impact
- #Future Outlook
- #Line
- #Line Chart
- #16:9
- #multi-line chart PowerPoint
- #trend analysis slide template
- #2-series line graph
- #data visualization presentation
- #revenue forecast chart download
About the Product
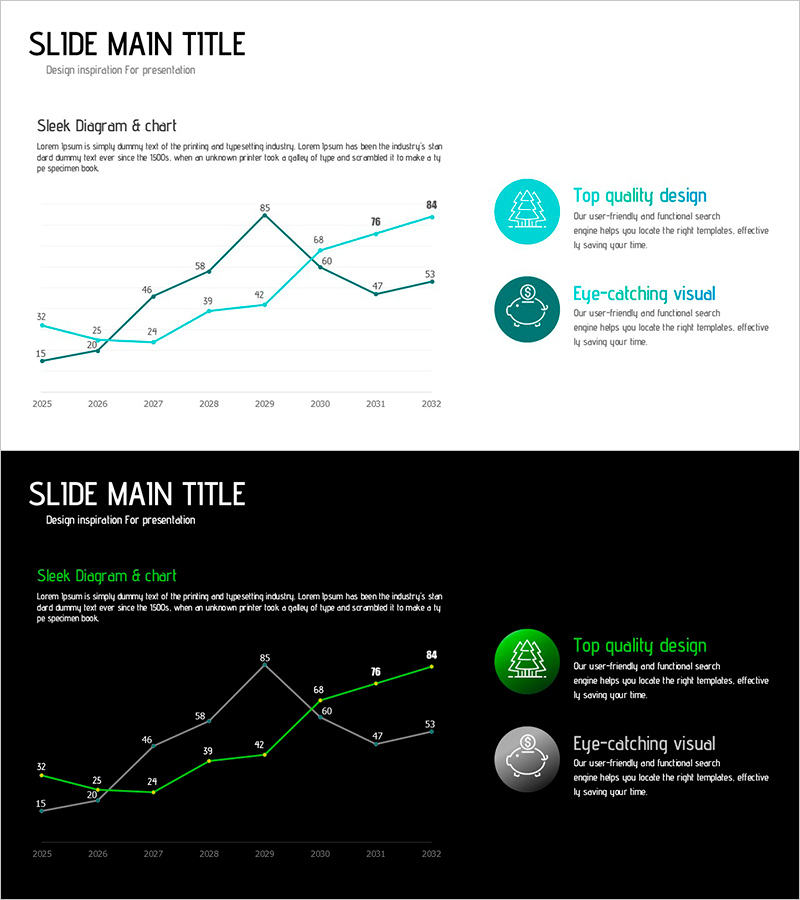
A multi-line trend chart PowerPoint slide that visualizes two data series over an 8-year period from 2005 to 2032. The mint green and dark teal lines clearly display changes in metrics such as revenue forecasts, growth rates, or market performance. Each data point is labeled with precise values for accurate information delivery. The right side features icon callouts with text areas to highlight key insights and strategic messages. This slide is ready to use in business presentations, financial reports, and investor pitch decks where temporal trend analysis is essential.
Usage Points
-
Main Usage
Compares and analyzes changes in two data metrics over time. Ideal for presenting revenue trends, sales growth, market share evolution, or performance metrics across multiple periods to support strategic decision-making.
-
How to Use
Insert this slide into business plans, quarterly performance reports, investor presentations, or strategic planning decks. Replace data values with actual figures, update the timeline as needed, and customize the icon callouts with relevant insights or conclusions.
-
Recommended For
CFOs, financial analysts, business strategists, and executive presenters. Suitable for quarterly earnings reviews, annual performance summaries, investment ROI analysis, and market trend presentations.
-
Slide Structure
Two-line chart with mint green and dark teal series, 8 time intervals (2005–2032), labeled data points with numeric values, two icon callout areas on the right with text boxes. Available in light and dark background versions.
Related Products
-

Visualizing Future Outlook and Expected Effects – Harmony of Green and Orange
#Business Strategy #Market and Competitor Analysis #Graph
-

Future Outlook and Expected Effects Graph – Harmony of Blue and Orange
#Business Strategy #Market and Competitor Analysis #Graph
-

Future Outlook and Expected Effects Visualization – Graph Representing Business Strategic Plans
#Business Strategy #Market and Competitor Analysis #Graph
-

Business Strategy Analysis with Line Chart
#Business Strategy #Market and Competitor Analysis #Diagram
