Camping Isometric Future Market Outlook Line Graph
RJ0600078_8
- Last Update 07/11/2025
- File Size 0.7MB
- # of Slides 2
- File Format PPTX
- Slide Ratio 16:9
- Color
Keywords
- #Content-Based Slides
- #Design-Based Slides
- #Market and Competitor Analysis
- #Financial Plans and Performance
- #Graph
- #Future Outlook
- #Sales and Revenue
- #Line
- #Line Chart
- #16:9
- #line chart PowerPoint
- #dual-series line graph template
- #market outlook slide
- #camping industry data visualization
- #trend analysis PowerPoint slide
About the Product
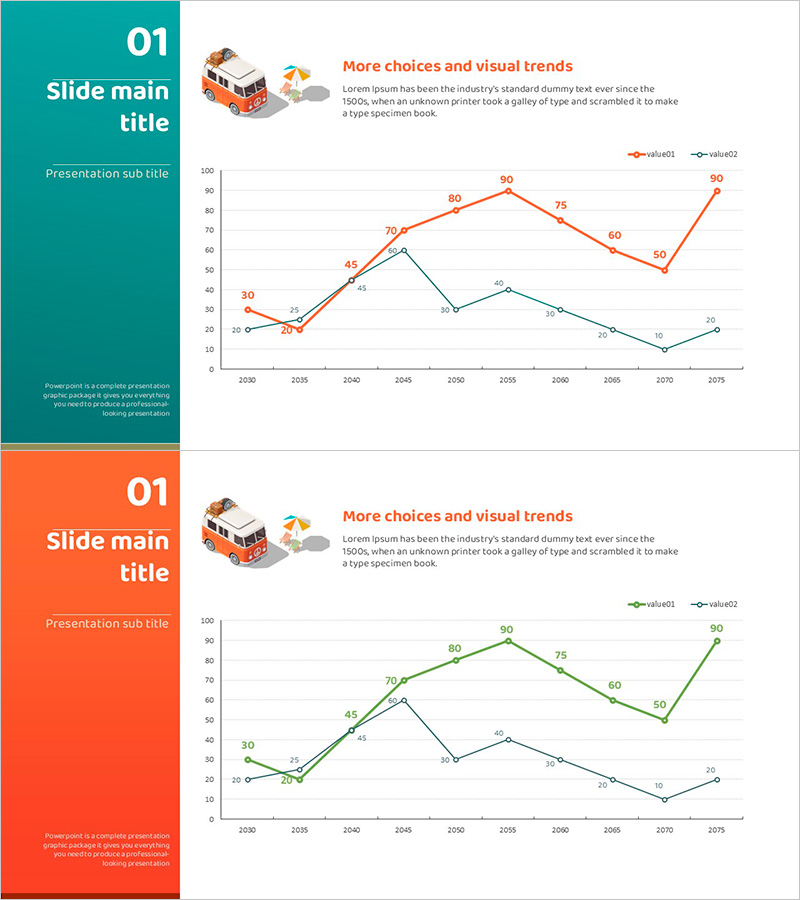
A 2-slide line graph PowerPoint template visualizing the camping industry's future market outlook from 2030 to 2075. Two data series—orange and gray lines—track diverging market trends across the decade-long period. Each slide features a split layout with a teal or orange color block on the left (for title and subtitle) and a white chart area on the right. A camping isometric illustration accompanies descriptive text, making this presentation slide ideal for financial planning and market analysis reports. Delivered in 16:9 widescreen PPTX format, fully editable in all PowerPoint versions.
Usage Points
-
Main Usage
Comparative data visualization of camping industry long-term market trends using two line series. Tracks numerical changes from 2030 to 2075, with orange line showing upward trajectory and gray line showing downward trend, illustrating market segmentation and divergence.
-
How to Use
Insert into financial planning, market analysis, or business performance report sections to explain camping industry growth rates, competitive comparisons, and revenue trends. Replace title and subtitle in the left color block, then update graph values with actual data. Ready for immediate presentation use.
-
Recommended For
Camping and leisure industry professionals, market researchers, financial analysts, business development managers, and investment pitch presenters. Particularly effective for industry growth rate comparisons, competitive positioning, and strategic planning discussions.
-
Slide Structure
2-slide deck. Each slide split into left color block (teal or orange, containing title and subtitle) and right white area (line chart). Chart features X-axis spanning 2030–2075, Y-axis scaled 0–100, two data series (orange and gray lines), numeric labels at each data point, and legend. Includes camping isometric illustration and descriptive text placement.
Related Products
-

Line Graph Visualizing Future Market Outlook for Sailing Travel
#Market and Competitor Analysis #Financial Plans and Performance #Graph
-

Origami Presentation Template Section Line Graph – Market and Performance Analysis
#Market and Competitor Analysis #Financial Plans and Performance #Graph
-

Rising Curve Graph for Sales Growth – Looking Ahead
#Market and Competitor Analysis #Financial Plans and Performance #Graph
-

Simple Car Wide Presentation Line Chart – Market and Competitive Analysis
#Market and Competitor Analysis #Financial Plans and Performance #Graph
