Rising Curve Graph for Sales Growth – Looking Ahead
RJ0600086_8
- Last Update 07/13/2025
- File Size 0.3MB
- # of Slides 2
- File Format PPTX
- Slide Ratio 16:9
- Color
Keywords
- #Content-Based Slides
- #Design-Based Slides
- #Market and Competitor Analysis
- #Financial Plans and Performance
- #Graph
- #Future Outlook
- #Sales and Revenue
- #Line
- #Line Chart
- #16:9
- #line chart PowerPoint
- #sales trend presentation
- #3-series chart slide
- #financial performance graph
- #line graph template download
About the Product
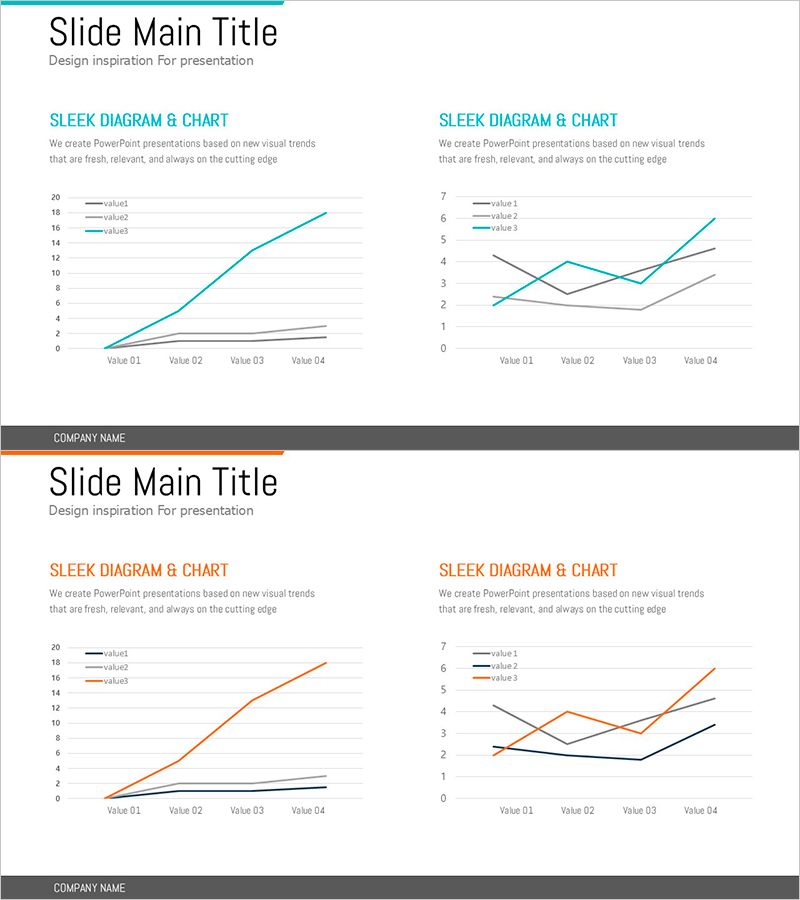
A professional line chart PowerPoint slide that clearly displays sales growth trends across multiple data series. This presentation template features three data series tracked over four quarters, enabling quick comparison of rising, declining, and fluctuating trends. The slide deck uses a teal, orange, and black color palette suitable for financial reports, competitive analysis, and future outlook sections. With two fully editable slides, you can input your own data and automatically update the charts. This ready-to-use PPT template is perfect for quarterly earnings presentations, investor pitches, and strategic business meetings.
Usage Points
-
Main Usage
Visualize quarterly or monthly sales trends, compare competitor performance metrics, and track financial KPI changes using line graphs. Rising trends demonstrate positive momentum while fluctuating patterns reveal market volatility and business dynamics.
-
How to Use
Insert into financial reports' performance analysis section, business plans' revenue forecasting pages, and investor pitch decks to demonstrate growth potential. Customize legend labels and axis titles to represent various metrics such as customer satisfaction scores, market share percentages, or cost reduction achievements.
-
Recommended For
CFOs and finance managers presenting quarterly earnings, marketing teams analyzing campaign performance, executives in strategy meetings, and startup founders pitching to investors. Ideal for any data-driven business presentation requiring trend analysis and performance comparison.
-
Slide Structure
Two-slide layout with left slide showing 3-series upward trend line chart (Value 01-04 with 4 data points, Y-axis 0-20) and right slide displaying 3-series fluctuating trend chart (Value 01-04 with 4 data points, Y-axis 0-7). Each slide includes title, description text, legend, and labeled axes.
Related Products
-

Simple Car Wide Presentation Line Chart – Market and Competitive Analysis
#Market and Competitor Analysis #Financial Plans and Performance #Graph
-

Market Trends with Key Focus Areas
#Market and Competitor Analysis #Financial Plans and Performance #Graph
-

Camping Isometric Future Market Outlook Line Graph
#Market and Competitor Analysis #Financial Plans and Performance #Graph
-

Real Estate Upside Down Chart – Visualizing Market Trends
#Market and Competitor Analysis #Financial Plans and Performance #Graph
