Rise and Fall Profit Chart – Decision Support through Data Visualization
RJ0300007_13
- Last Update 04/20/2025
- File Size 0.2MB
- # of Slides 2
- File Format PPTX
- Slide Ratio 16:9
- Color
Keywords
About the Product
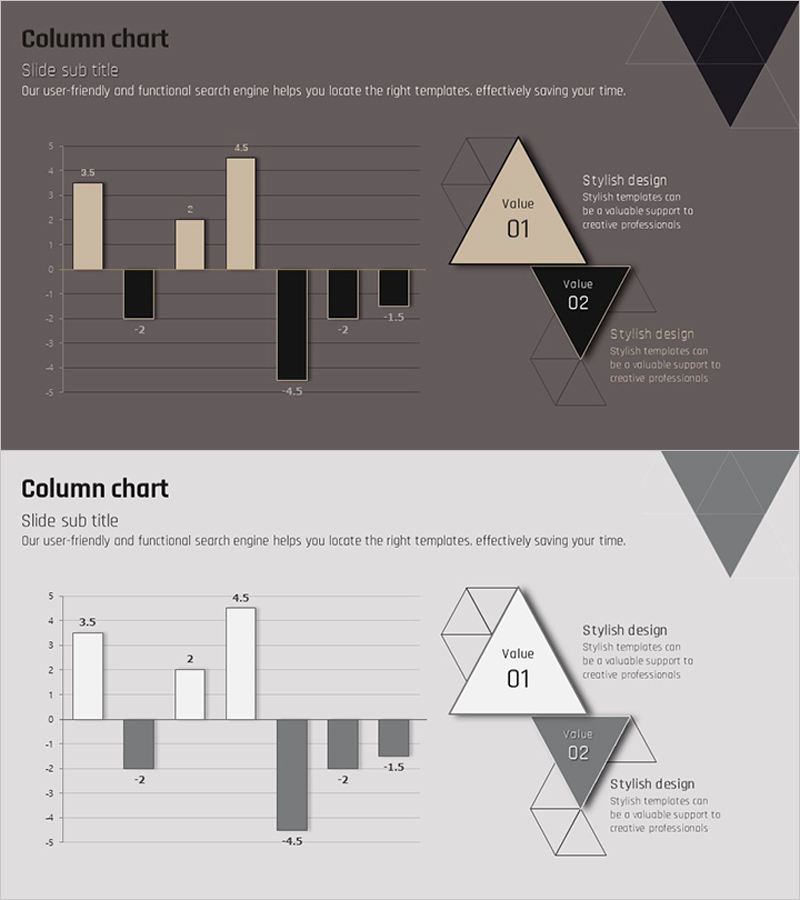
A rise and fall profit chart PowerPoint slide that visualizes positive and negative financial data simultaneously. This 2-slide set features a dark gray background with beige and black bars, effectively displaying revenue fluctuations and profitability changes. Ideal for financial reports, performance analysis, and profit trend presentations, this PPT template converts complex numerical data into clear, actionable visualizations to support decision-making. Delivered in 16:9 widescreen PPTX format, compatible with all presentation environments.
Usage Points
-
Main Usage
Communicate financial performance, profit trends, and revenue changes to executives, investors, and stakeholders using dual-direction bars. Suitable for quarterly and annual performance comparisons, departmental profitability analysis, product-level profit and loss visualization, and comprehensive financial data representation.
-
How to Use
Slide 1 features a professional dark-background chart layout; Slide 2 provides a light-background alternative design. Edit bar values to input actual financial data and use triangle text boxes to highlight key insights. Customize colors to match your brand guidelines and corporate presentation standards.
-
Recommended For
CFOs, financial managers, executives, investor relations professionals, quarterly and annual earnings presentations, financial reports, investment pitch decks, board meetings, and business performance analysis presentations.
-
Slide Structure
2-slide set. Slide 1: Dark gray background with 8-item rise-fall bars (positive beige, negative black) plus two triangle text boxes on the right (Value 01, 02). Slide 2: Light gray background with identical structure for contrast. Y-axis range -5 to 5 with gridlines on both slides.
Related Products
-

Gender Ratio Customer Analysis Pie Chart – Emphasizing Customer Insights
#Market and Competitor Analysis #Graph #Other
-

User Analysis Graph by Age Group – Advanced Data Insights
#Market and Competitor Analysis #Diagram #Graph
-

Bar Graph of Progress Analysis by Task - Effective Visualization of Progress
#Product/Service Introduction #Market and Competitor Analysis #Marketing Plan and Strategy
-

Graph of Analysis of Employee Card Usage - Market and Competitor Analysis
#Market and Competitor Analysis #Graph #Competitor Analysis
