Orange Green Achievement Graph – Visualizing Goal Attainment
RJ0500031_26
- Last Update 06/15/2025
- File Size 1.7MB
- # of Slides 2
- File Format PPTX
- Slide Ratio 16:9
- Color
Keywords
- #Content-Based Slides
- #Design-Based Slides
- #Business Strategy
- #Market and Competitor Analysis
- #Graph
- #Other
- #Competitive Advantage
- #Horizontal Bar
- #Horizontal Bar Chart
- #Project Progress
- #16:9
- #horizontal bar chart PowerPoint
- #goal achievement graph slide
- #business progress visualization
- #performance metrics PowerPoint template
- #comparative analysis slide
About the Product
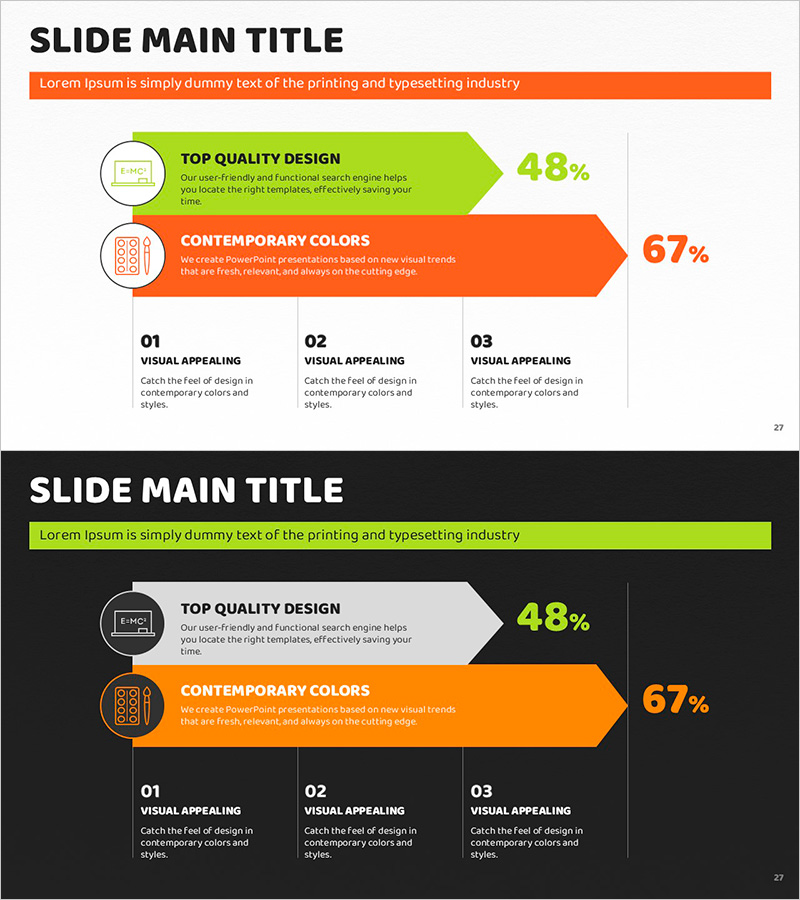
A 2-slide horizontal bar chart PowerPoint template designed to visualize business progress and goal attainment. Two bar graphs in orange and green colors are positioned at the top, clearly displaying achievement percentages for each metric. Below, three key strategic points are arranged with icons to emphasize core messages. Created in 16:9 widescreen format optimized for modern presentation environments, this PPTX file is fully editable and ready for immediate use in executive reports and performance reviews.
Usage Points
-
Main Usage
Ideal for reporting business progress, comparing goal achievement rates, and visualizing performance indicators. The dual bar graphs simultaneously display current status and targets, making it perfect for executive reports, quarterly performance presentations, and strategic planning meetings.
-
How to Use
Enter actual figures and percentages into the orange and green bar graphs to represent goal achievement levels. Edit the three bottom items' text and icons to highlight key strategic points. Colors and values are fully customizable to match your corporate branding and data requirements.
-
Recommended For
Executives, business managers, marketing teams, and project managers presenting quarterly performance reports, goal-versus-actual analysis, and business progress updates. Particularly effective for data-driven decision-making in board meetings and management reviews.
-
Slide Structure
Two-slide layout with header area containing title and descriptive text, followed by two horizontal bar graphs (displaying 48% and 67% achievement rates) in orange and green. Circular icon badges appear on the left of each graph with percentage values on the right. Bottom section features three text boxes with icons arranged horizontally for key messaging.
Related Products
-

City Map & Population Density Insights Slide – Market and Competitive Analysis
#Market and Competitor Analysis #Graph #Other
-

Pencil Horizontal Chart Competitive Advantage - Visualizing Market Status
#Market and Competitor Analysis #Graph #Other
-

Meat and Vegetable Consumption by Region – Market Status Analysis
#Market and Competitor Analysis #Graph #Other
-

Priority Graph by Color – Emphasizing Competitive Advantage
#Market and Competitor Analysis #Graph #Other
