Business Competitor Analysis Comparison Graph – Market Status Insight
RM0100001_10
- Last Update 01/24/2025
- File Size 2.7MB
- # of Slides 2
- File Format PPTX
- Slide Ratio 16:9
- Color
Keywords
- #Content-Based Slides
- #Design-Based Slides
- #Market and Competitor Analysis
- #Diagram
- #Graph
- #Competitor Analysis
- #Market Analysis
- #Table
- #Line
- #Line Chart
- #16:9
- #line chart PowerPoint slide
- #market analysis presentation template
- #competitor comparison graph
- #trend analysis slides
- #multi-series chart PPT download
About the Product
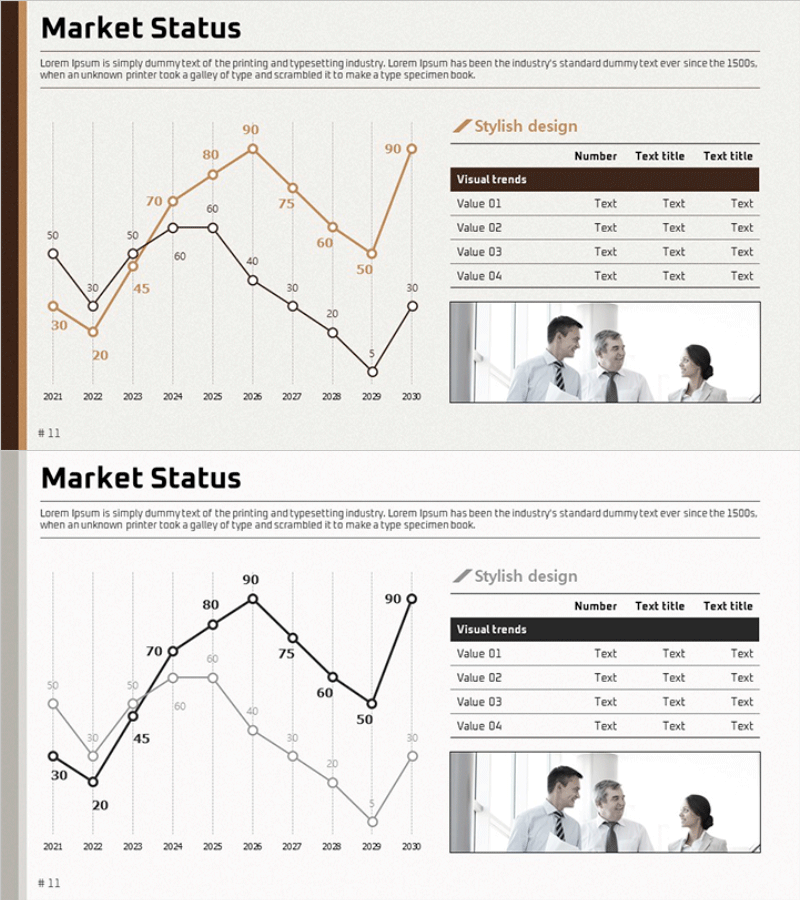
A professional multi-series line chart PowerPoint slide designed for business competitor analysis and market status visualization. This presentation template features two distinct data series (orange and black lines) tracking trends from 2021 to 2030, with clearly labeled data points showing exact values. The slide includes a grid background, legend, and dedicated text area for insights and analysis. Perfect for business reports, investor presentations, and strategic planning meetings. The 16:9 widescreen format with 2-slide layout is ready to edit and deploy immediately.
Usage Points
-
Main Usage
This multi-series line chart slide enables clear visualization of market trends and competitive performance over time. By displaying two data series simultaneously, it allows audiences to compare trajectories, identify inflection points, and understand relative market positioning—essential for business reports, quarterly reviews, and investor communications.
-
How to Use
Simply replace the sample data points and numerical labels with your own metrics. Customize the line colors to match your corporate branding, add your analysis insights to the text box on the right, and update the title and legend. All elements are fully editable in PowerPoint for seamless integration into your presentation.
-
Recommended For
Ideal for executives, business development teams, marketing professionals, consultants, and data analysts presenting market analysis. Use cases include quarterly performance reviews, competitive benchmarking, industry trend analysis, ROI tracking, sales forecasting, and strategic planning presentations.
-
Slide Structure
2-slide set featuring a title area, dual-line chart with 10 data points per series (2021–2030), grid background for clarity, legend, and a right-side text box containing a Visual Trends table and image placeholder. The 16:9 widescreen format ensures optimal display on modern projectors and monitors.
Related Products
-

Line Chart & Table – Market and Competitor Analysis
#Market and Competitor Analysis #Diagram #Graph
-

Market Analysis Graph Template – Effective Tool for Competitor Analysis
#Market and Competitor Analysis #Diagram #Graph
-

Black Navy Broken Line Graph Table – Market and Competitor Analysis
#Market and Competitor Analysis #Diagram #Graph
-

Graph Chart for Analysis Comparison – Market and Competitor Analysis
#Market and Competitor Analysis #Diagram #Graph
