Paper City Theme Circular Diagram – Visualizing Cyclical Flow
RJ0300002_4
- Last Update 04/19/2025
- File Size 14MB
- # of Slides 2
- File Format PPTX
- Slide Ratio 16:9
- Color
Keywords
- #Content-Based Slides
- #Design-Based Slides
- #Company Introduction
- #Business Introduction
- #Diagram
- #Business Areas
- #Flow
- #Circular Flow
- #16:9
- #circular diagram PowerPoint
- #3-step cycle slide
- #circular flow diagram template
- #process flow PPT slide
- #business cycle diagram
- #cyclical process visualization
About the Product
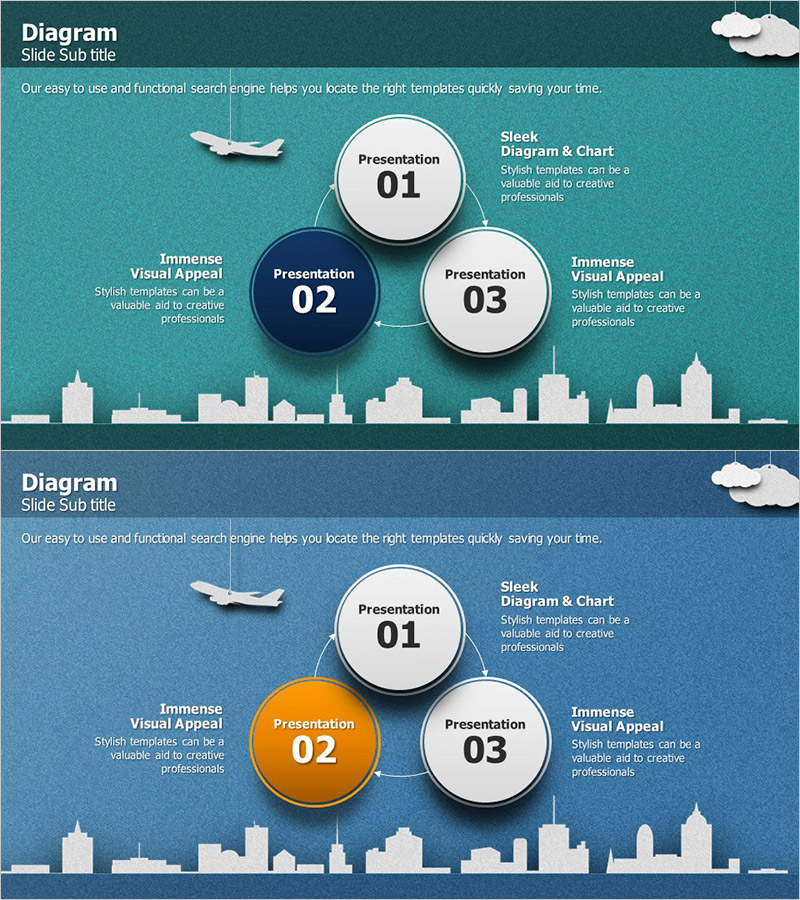
A 3-node circular flow diagram PowerPoint slide featuring a teal gradient background with white and navy circular nodes connected by directional arrows. The design incorporates a city skyline silhouette and airplane icon to emphasize global business context. This 2-slide set provides color variations (navy emphasis and orange emphasis) for flexible presentation scenarios. Delivered in 16:9 widescreen PPTX format, fully editable and ready to use. Ideal for company introductions, business process explanations, strategic cycle descriptions, and cyclical workflow visualizations in corporate presentations.
Usage Points
-
Main Usage
Visualizes cyclical processes, repeating cycles, and circular workflows in three distinct stages. Perfect for illustrating business cycle models in company introductions, product development cycles in business overviews, and continuous improvement processes in strategy sections.
-
How to Use
Enter stage names or process labels in each circular node and add descriptions in text boxes. Utilize the two color-variation slides (navy emphasis and orange emphasis) to visually distinguish key stages. The background city skyline and airplane icon can be retained or removed as needed.
-
Recommended For
Recommended for global business, IT, consulting, and financial sector presentations. Effective for executives, business managers, and marketing teams explaining cyclical structures, continuous improvement initiatives, and cycle-based strategies.
-
Slide Structure
Three circular nodes (approximately 80px diameter) arranged in triangular formation with directional arrows. Central node in dark navy, upper and right nodes in white. Arrows (2–3pt line weight) indicate clockwise flow. Background: teal gradient with city skyline silhouette and airplane icon. Both slides maintain identical structure with color variations (Slide 2 features orange node emphasis).
Related Products
-

Cybersecurity Business Area Diagram – Safe Directions
#Company Introduction #Business Introduction #Diagram
-

Cycle Diagram to Visualize Chemistry Concepts
#Company Introduction #Business Introduction #Diagram
-

Business Area Diffusion Diagram - Flow of Business Domains
#Company Introduction #Business Introduction #Diagram
-

Business Area Diffusion Diagram – Strategic Business Model
#Company Introduction #Business Introduction #Diagram
