Market Share Global Map – Real-Time Data for Market Analysis
RJ0600103_22
- Last Update 07/18/2025
- File Size 0.9MB
- # of Slides 2
- File Format PPTX
- Slide Ratio 16:9
- Color
Keywords
About the Product
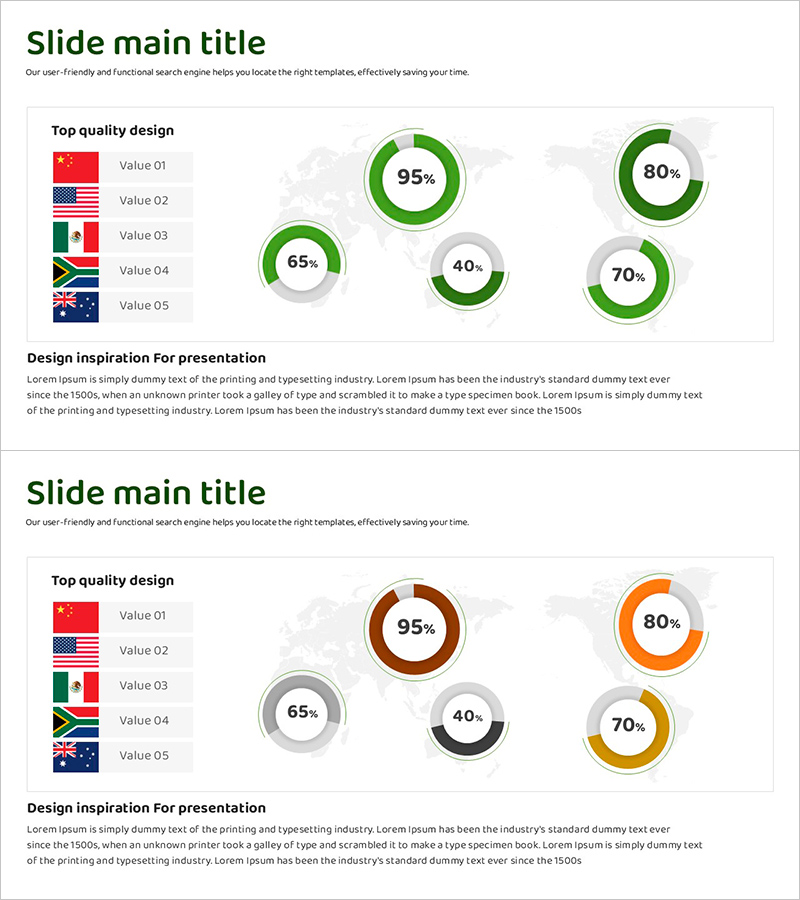
A PowerPoint slide deck featuring five donut-shaped pie charts for comparing global market share across five countries. The charts display varying percentages (95%, 80%, 70%, 65%, 40%) with green and orange color schemes. A legend on the left side shows country flags (China, USA, Mexico, South Africa, Australia) for easy reference, while a faint world map background reinforces the global context. Two slide variations are included: the first uses a green color palette, and the second features an orange, gray, and black palette, allowing you to match your presentation's visual tone. Provided in 16:9 widescreen PPTX format for immediate editing and data customization.
Usage Points
-
Main Usage
Visualize and compare market share, sales distribution, and customer concentration across countries or regions. The donut chart format clearly shows each item's proportion relative to the whole, while the five-chart layout enables simultaneous comparison of multiple metrics at a glance.
-
How to Use
Use in investor presentations, executive reports, marketing strategy briefings, and business performance analyses to explain market conditions. Replace the percentage values with your actual data and update the country names in the legend to match your regions, departments, or product categories for immediate deployment.
-
Recommended For
Ideal for executives, marketing managers, business analysts, consultants, and finance professionals presenting market analysis, competitive comparisons, and sales performance reports. Particularly suited for global business contexts requiring multi-country or multi-region data comparison.
-
Slide Structure
Two-slide set. Each slide contains a title area, five donut-shaped charts (center 95%, top-right 80%, bottom-right 70%, left-center 65%, bottom-center 40%), a left-side legend with five country flags and labels, and a subtle world map background. Slide 1 uses green and gray tones; Slide 2 features orange, gray, and black tones.
Related Products
-

Red Market Share Slide – Compelling Donut Chart Design
#Market and Competitor Analysis #Graph #Market Share
-

Soccer Match Analysis Chart – Performance Analysis and Future Forecast
#Business Vision and Strategy #Market and Competitor Analysis #Graph
-

Donut Chart Slide for Dessert Menu Research – Market Analysis
#Market and Competitor Analysis #Diagram #Graph
-

World Map and Share Chart for Market Analysis – Effective Data Visualization
#Market and Competitor Analysis #Graph #Other
