Guiding Slide Representing Future Vision – Current Status of Business
RM0200017_4
- Last Update 10/04/2025
- File Size 0.4MB
- # of Slides 2
- File Format PPTX
- Slide Ratio 16:9
- Color
Keywords
- #Content-Based Slides
- #Design-Based Slides
- #Company Introduction
- #Business Vision and Strategy
- #Business Strategy
- #Diagram
- #History
- #Business Goals
- #Roadmap
- #Flow
- #Linear Flow
- #Project Progress
- #16:9
- #timeline diagram PowerPoint
- #business progress slide
- #year-by-year plan presentation
- #4-stage arrow diagram
- #business status PowerPoint template
About the Product
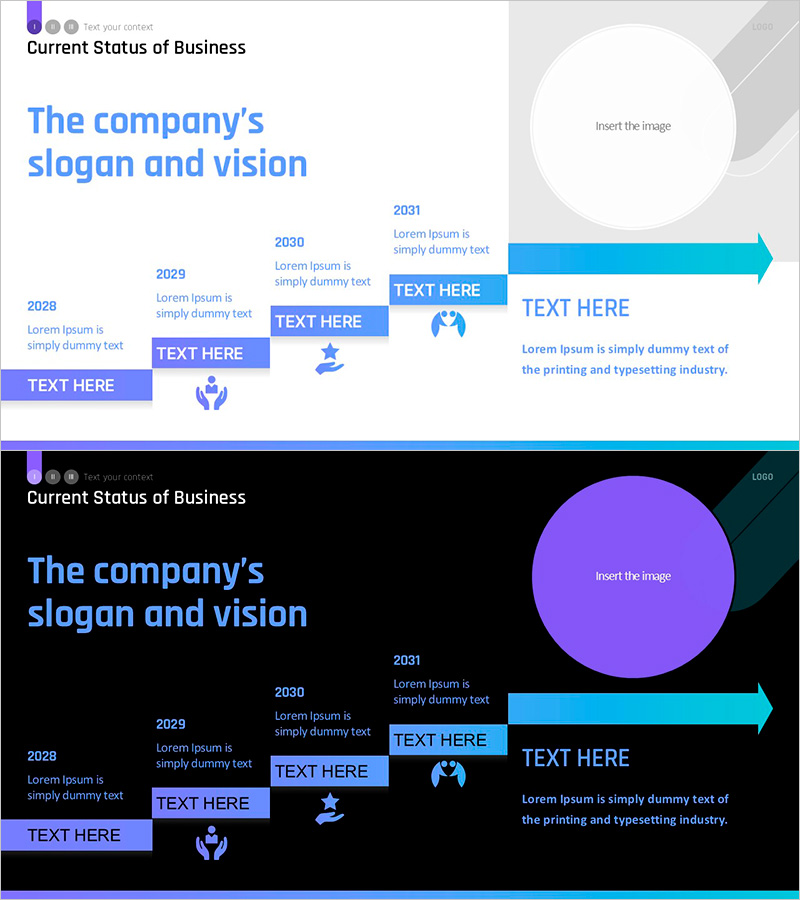
A PowerPoint slide that visualizes business progress from 2028 to 2031 across four consecutive years. The linear timeline flows from left to right, with each year's key content represented through text boxes and icons. The design features a blue gradient background, purple accent boxes, and cyan arrows that effectively communicate current business status and future vision. A circular image placeholder on the right side accommodates company logos or key visual assets. This presentation template is ready for immediate use in corporate presentations, business briefings, and annual reports.
Usage Points
-
Main Usage
Clearly presents year-by-year business milestones and stage-by-stage objectives along a chronological timeline. Each year's achievements and plans are organized through text and icons to enhance audience comprehension, while the right-side circular area maintains brand consistency by accommodating company logos or key visuals.
-
How to Use
Ideal for corporate presentations, business reports, investor briefings, and strategic planning sessions where past achievements and future plans must be presented simultaneously. Customize by entering specific accomplishments, goals, and strategies in each year's text box, and modify icons to match your business sector.
-
Recommended For
Executives, business managers, and marketing teams presenting business status and future plans to internal and external stakeholders. Particularly effective for visualizing medium-term business plans (3-5 years) or tracking quarterly and annual performance metrics.
-
Slide Structure
Title area in upper left, central linear timeline connecting four years (2028–2031). Each year includes one purple text box, one icon, and descriptive text. Right side features a circular image placeholder and a cyan arrow at the far right indicating future direction. Provided in two slide versions with light and dark backgrounds.
Related Products
-

Molecular Graphics History – Business Vision and Goals
#Company Introduction #Business Vision and Strategy #Diagram
-

Green & Gray Template Wide History
#Company Introduction #Business Strategy #Diagram
-

Goal Setting for Summit Achievement
#Business Vision and Strategy #Business Strategy #Diagram
-

Adventure Company History 4 Color Connection Diagram
#Company Introduction #Business Strategy #Diagram
