Instrument Illustration and Flow Diagram - Emphasizing Business Strategy
RJ0500020_6
- Last Update 06/12/2025
- File Size 0.6MB
- # of Slides 2
- File Format PPTX
- Slide Ratio 16:9
- Color
Keywords
- #Content-Based Slides
- #Design-Based Slides
- #Business Strategy
- #Diagram
- #Roadmap
- #Flow
- #Linear Flow
- #Project Progress
- #16:9
- #timeline flow diagram PowerPoint
- #business progress slide template
- #6-stage process diagram
- #milestone visualization PPT
- #project timeline PowerPoint slide
- #how to create timeline diagram in PowerPoint
About the Product
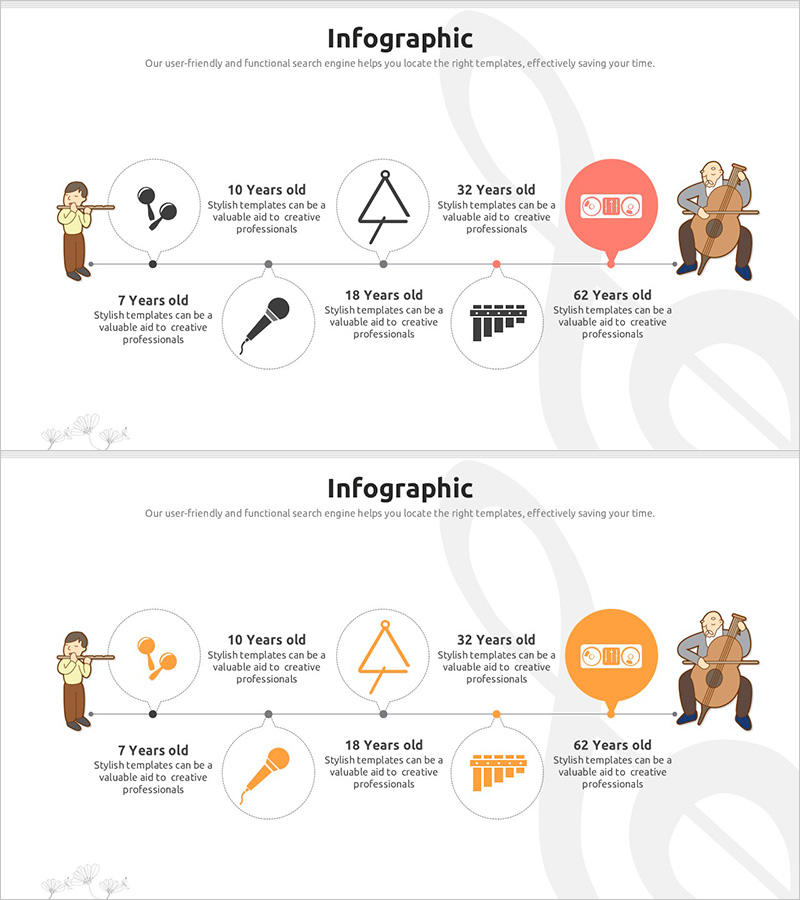
A 6-stage timeline flow diagram PowerPoint slide that visualizes business progress and project milestones over time. The design combines musical instrument illustrations with circular nodes to create a visually engaging representation of each phase. Key milestones (10 years, 32 years, 62 years) are highlighted with accent colors at the top, while supporting stages (7 years, 18 years) are positioned below in neutral tones to establish clear information hierarchy. This PowerPoint slide is ready to use in business presentations, strategic reports, and project documentation to explain project progression, organizational growth, or development roadmaps.
Usage Points
-
Main Usage
Visualizes business progress, project phases, organizational growth, and product development roadmaps along a chronological timeline. Key milestones are emphasized with accent colors to draw audience attention, enabling viewers to grasp the entire project schedule at a glance.
-
How to Use
Enter milestone information in the top timeline nodes and add supporting details in the lower stages. Use the musical instrument illustrations and color emphasis to convey importance. During presentations, explain achievements at each stage and outline objectives for the next phase.
-
Recommended For
Ideal for business strategy presentations, executive reports, project status updates, organizational growth narratives, and product development roadmap presentations. Particularly effective when emphasizing performance changes over time or highlighting stage-by-stage goal achievement.
-
Slide Structure
Linear timeline composed of 6 nodes. The top 3 nodes (10 years, 32 years, 62 years) are represented as circular shapes in accent colors (red/orange), while the bottom 3 nodes (7 years, 18 years) are positioned in neutral-tone circles. Each node includes a text description area, with musical instrument illustrations positioned at both ends for visual balance.
Related Products
-

Guiding Slide Representing Future Vision – Current Status of Business
#Company Introduction #Business Vision and Strategy #Business Strategy
-

Annual Match Plan and Strategy – Vision and Growth
#Business Strategy #Diagram #Other
-

Slide Highlighting Top Quality Design – Emphasizing Readability and Professionalism
#Business Strategy #Business Management #Diagram
-

Witch and Stage Guide Flow – Business Strategy Diagram
#Business Strategy #Diagram #Text Box
