Curved Theme Purple Template Donut Chart – A Stylish Choice for Market Analysis
RJ0200068_6
- Last Update 04/18/2025
- File Size 0.4MB
- # of Slides 2
- File Format PPTX
- Slide Ratio 16:9
- Color
Keywords
- #Content-Based Slides
- #Design-Based Slides
- #Company Introduction
- #Market and Competitor Analysis
- #Graph
- #Key Achievements
- #Market Analysis
- #Circles
- #Doughnut Chart
- #16:9
- #donut chart PowerPoint slide
- #pie chart template
- #4-segment data visualization
- #market analysis chart
- #ratio presentation template
About the Product
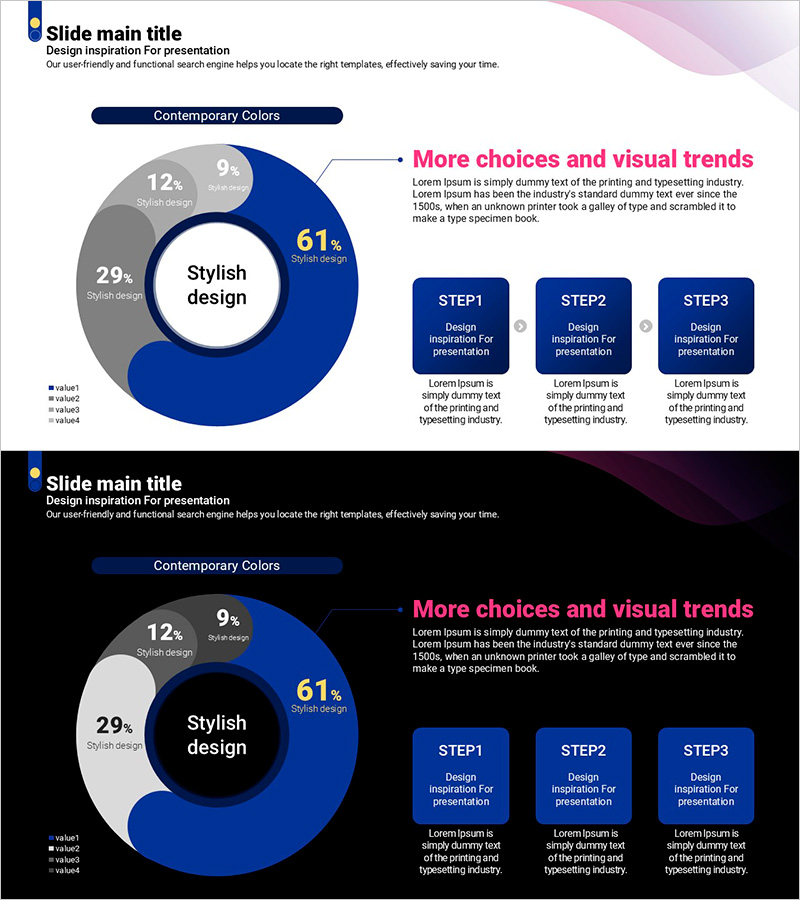
A donut chart PowerPoint slide optimized for market analysis and ratio representation. The design features four segments in purple, gray, and blue tones with a central circular area for key messaging. Two slide layouts are provided—one with a light background and one with a dark background—allowing you to choose based on your presentation environment. Each data segment displays percentage values to clearly communicate composition ratios. This template is ready to use in presentations, reports, business proposals, and strategic documents.
Usage Points
-
Main Usage
Visualize market share, product composition, customer distribution, and other proportional data across four categories. The donut structure's central circular area highlights key metrics or titles, while color-coded segments make each category instantly recognizable.
-
How to Use
Open the slide and replace the percentage values with your actual data. Update the legend labels to match your categories and add a title or metric in the central area. Adjust colors if needed to align with your brand guidelines. Select either the light or dark background version depending on your presentation setting.
-
Recommended For
Ideal for marketing teams presenting market analysis, sales teams explaining customer composition, executive reports showing business unit ratios, and consulting proposals requiring data visualization. Works best when presenting four or fewer data categories that need clear proportional comparison.
-
Slide Structure
Two-slide layout. Slide 1: Light background (white/soft pink) with purple, gray, blue, and light blue 4-segment donut chart, central text area showing '61% Stylish design', right side with descriptive text and three-step process boxes. Slide 2: Black background with identical donut structure for enhanced contrast. 16:9 widescreen format, PPTX file.
Related Products
-

Data-driven Market Analysis Strategy – Sleek Graph Slide
#Company Introduction #Market and Competitor Analysis #Graph
-

Achievement Performance and Goal Analysis Chart – Visualizing Performance
#Company Introduction #Market and Competitor Analysis #Graph
-

Market Sales by Tea Type – Highlighting Key Performance
#Company Introduction #Financial Plans and Performance #Graph
-

Status Analysis Donut Chart – Visualizing Market and Shareholder Status
#Company Introduction #Market and Competitor Analysis #Diagram
