Shareholder Status Analysis Donut Chart – Insights and Analysis
RM0300003_7
- Last Update 02/07/2025
- File Size 0.3MB
- # of Slides 2
- File Format PPTX
- Slide Ratio 16:9
- Color
Keywords
- #Content-Based Slides
- #Design-Based Slides
- #Company Introduction
- #Market and Competitor Analysis
- #Diagram
- #Graph
- #Shareholder Structure
- #Market Analysis
- #Table
- #Circles
- #Standard Table
- #Doughnut Chart
- #16:9
- #donut chart PowerPoint
- #pie chart slide template
- #shareholder analysis template
- #data visualization slides
- #ratio chart PPT download
About the Product
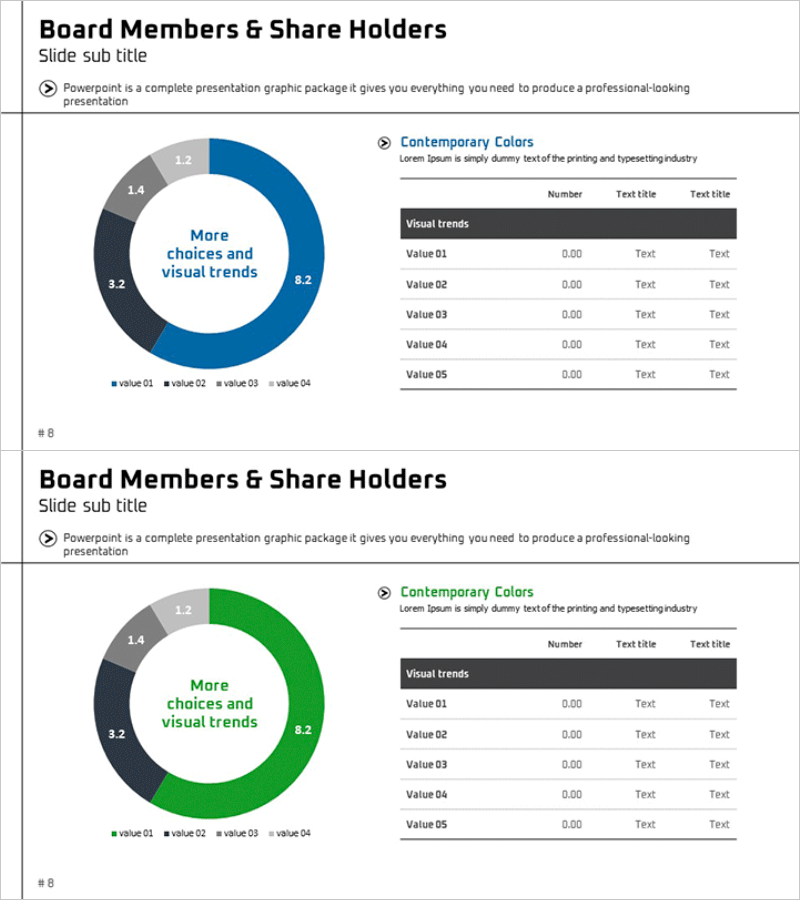
A professional donut chart PowerPoint slide designed for shareholder status analysis and capital structure visualization. The 4-segment donut graph uses navy blue, dark gray, bright blue, and light gray color schemes to represent shareholding ratios, investor composition, capital allocation, and equity distribution. The accompanying data table on the right allows you to input numerical values (Value 01–05) that automatically update the chart, making it ideal for company presentations, investor pitch decks, and annual shareholder meetings. The 2-slide set includes both blue and green color variations, enabling you to select the version that best matches your presentation theme and corporate branding.
Usage Points
-
Main Usage
Effectively visualizes proportional data such as shareholder composition, capital allocation, market share, departmental headcount distribution, and revenue breakdown by segment. The donut format leverages the center space to highlight key metrics or titles, adding credibility and visual impact to corporate presentations and investor relations documents.
-
How to Use
Enter actual numerical values into the Value 01–05 cells in the data table on the right, and the donut chart will automatically update. Click on the legend items (value 01–04) to edit category names, and adjust chart colors as needed. Choose between the blue or green color version from the 2-slide set to match your presentation theme.
-
Recommended For
CFOs, finance managers, and executives presenting shareholder composition and capital structure at investor meetings, annual shareholder assemblies, and board presentations. Marketing teams can also use this template to illustrate market share, customer segmentation, and product sales distribution in analytical reports.
-
Slide Structure
Slide 1: Navy blue donut chart (4 segments) with data table (5 rows) on the right / Slide 2: Green donut chart (4 segments) with identical table structure. Each slide includes a title area, donut chart visualization, legend, and editable data input table.
Related Products
-

Visualizing Board Members and Shareholders with a Sleek Diagram
#Company Introduction #Market and Competitor Analysis #Diagram
-

Status Analysis Donut Chart – Visualizing Market and Shareholder Status
#Company Introduction #Market and Competitor Analysis #Diagram
-

Shareholder Status Analysis Donut Pie Chart – Corporate Growth and Competitive Analysis
#Company Introduction #Market and Competitor Analysis #Diagram
-

Shareholder Status Analysis Slide – Data-Driven Market Insights
#Company Introduction #Market and Competitor Analysis #Diagram
