Curved Theme Purple Bar Chart – Effective Performance Analysis
RJ0200068_21
- Last Update 04/18/2025
- File Size 0.4MB
- # of Slides 2
- File Format PPTX
- Slide Ratio 16:9
- Color
Keywords
- #Content-Based Slides
- #Design-Based Slides
- #Company Introduction
- #Business Strategy
- #Graph
- #Key Achievements
- #Achievements
- #Horizontal Bar
- #Segmented Horizontal Bar
- #16:9
- #horizontal bar chart PowerPoint
- #performance analysis slide template
- #purple bar chart
- #6-item comparison graph
- #business metrics presentation slide
About the Product
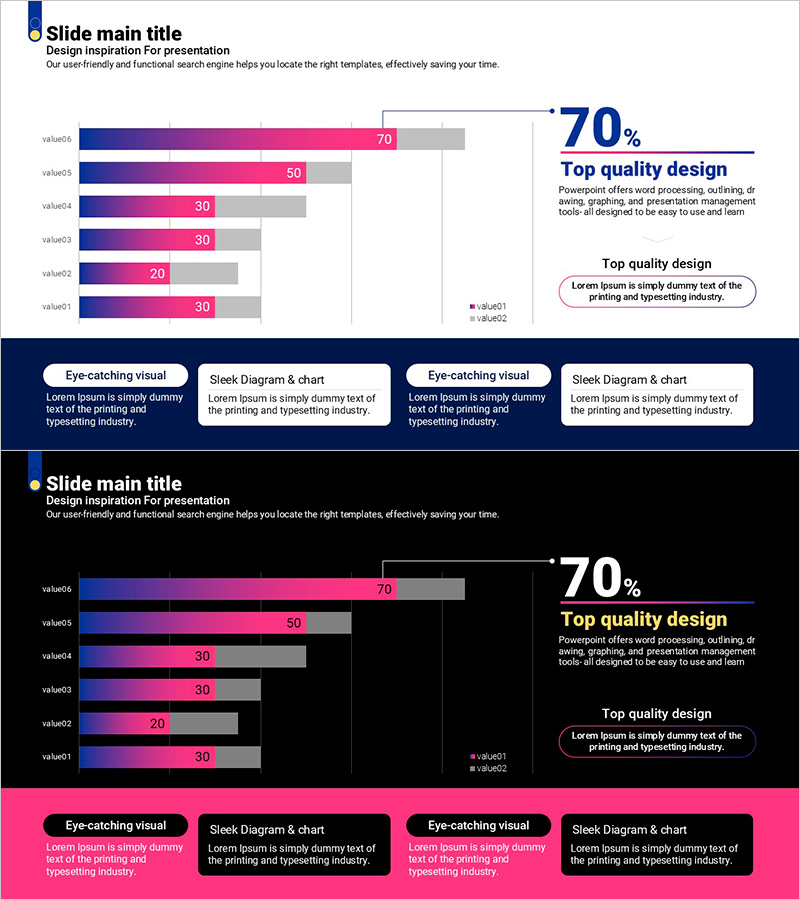
A horizontal bar chart PowerPoint slide with curved theme and purple gradient design. This presentation template features six data items displayed as horizontal bars with a blue-to-pink gradient effect. The top section highlights a 70% metric with 'Top quality design' callout box to emphasize key performance results. Ideal for business strategy presentations, performance analysis, and comparative metrics reporting. Ready to edit and customize with your own data for immediate use in professional presentations.
Usage Points
-
Main Usage
Visualize quantitative data comparison and performance metrics with clarity and impact. The horizontal bar layout allows viewers to quickly compare six data points side-by-side. The highlighted 70% metric draws attention to key performance indicators and critical business outcomes.
-
How to Use
Use in business performance reports, quarterly results presentations, departmental KPI comparisons, competitive benchmarking, and sales performance reviews. Simply replace the data values and labels with your own metrics. Adjust the number of bars or modify colors to match your corporate branding as needed.
-
Recommended For
Executive presentations, quarterly business reviews, marketing performance reports, sales pipeline analysis, project status updates, and financial performance meetings. Ideal for finance teams, sales managers, marketing directors, project managers, and business analysts presenting quantitative results to stakeholders.
-
Slide Structure
Two-slide set with matching layouts on light and dark backgrounds. First slide features six horizontal bars with gradient coloring on a light background, accompanied by a 70% metric highlight and descriptive text box on the right. Second slide mirrors the design on a dark background for presentation flexibility and visual variety across different meeting environments.
Related Products
-

Medal Text Box – Highlighting Achievements in Presentations
#Company Introduction #Business Strategy #Diagram
-

Key Performance Diagram - Clarity for Business Strategy
#Company Introduction #Business Strategy #Diagram
-

Chart Analysis of External Activities – Performance and Strategy
#Company Introduction #Business Strategy #Diagram
-

Skill Graph for Performance Visualization – Vision and Growth
#Company Introduction #Product/Service Introduction #Graph
