Graph Slide Visualizing Performance and Future Prospects in Pink and Bluegreen
RJ0400010_32
- Last Update 05/19/2025
- File Size 0.2MB
- # of Slides 2
- File Format PPTX
- Slide Ratio 16:9
- Color
Keywords
- #Content-Based Slides
- #Design-Based Slides
- #Company Introduction
- #Business Strategy
- #Graph
- #Other
- #Key Achievements
- #Achievements
- #16:9
- #area chart PowerPoint slide
- #performance analysis presentation
- #data visualization slide
- #dual-layer comparison chart
- #how to create performance trends in PowerPoint
About the Product
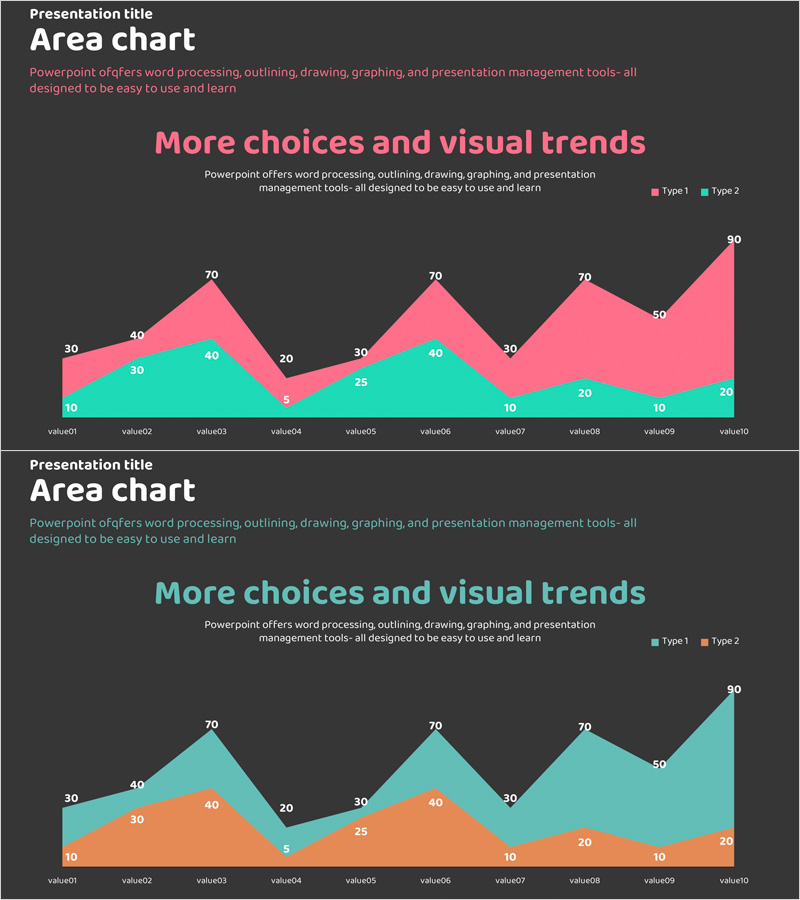
A PowerPoint area chart slide that visualizes performance metrics and future prospects with dual-layer data representation. The dark background features teal and pink color layers showing 10 data points across time, enabling clear comparison of trends and forecasts. Ideal for investor presentations, quarterly business reports, marketing analysis decks, and strategic planning sessions. The 2-slide set allows flexible data visualization for different datasets and reporting scenarios.
Usage Points
-
Main Usage
Simultaneously display performance trends and future forecasts using a dual-layer area chart, enabling clear communication of growth trajectory and strategic outlook to investors, executives, and stakeholders.
-
How to Use
Apply to investor relations presentations (IR) performance sections, quarterly and annual business reports, marketing campaign analysis, strategic planning meetings, and competitive market analysis slides.
-
Recommended For
CFOs and finance teams presenting quarterly results, marketing departments analyzing campaign performance, executives preparing strategy meeting materials, investor relations professionals, and consulting firms creating client analysis reports.
-
Slide Structure
2-slide set with title area, legend, and area chart on each slide. Displays 10 data points across two layers (Type 1 and Type 2) with numerical values clearly labeled for precise data communication and easy customization.
Related Products
-

Game Service Operation and Product Sales Performance – Data Visualization
#Company Introduction #Business Strategy #Graph
-

Circular Graph by Instrument – Performance and Strategy
#Company Introduction #Business Strategy #Graph
-

Performance and Future Prospects Green Navy – Business Strategy through Data Visualization
#Company Introduction #Business Strategy #Graph
-

Business Data Overview Slide - Performance Visualization
#Company Introduction #Business Strategy #Graph
