Performance and Future Prospects Green Navy – Business Strategy through Data Visualization
RJ0400014_15
- Last Update 05/21/2025
- File Size 0.1MB
- # of Slides 2
- File Format PPTX
- Slide Ratio 16:9
- Color
Keywords
About the Product
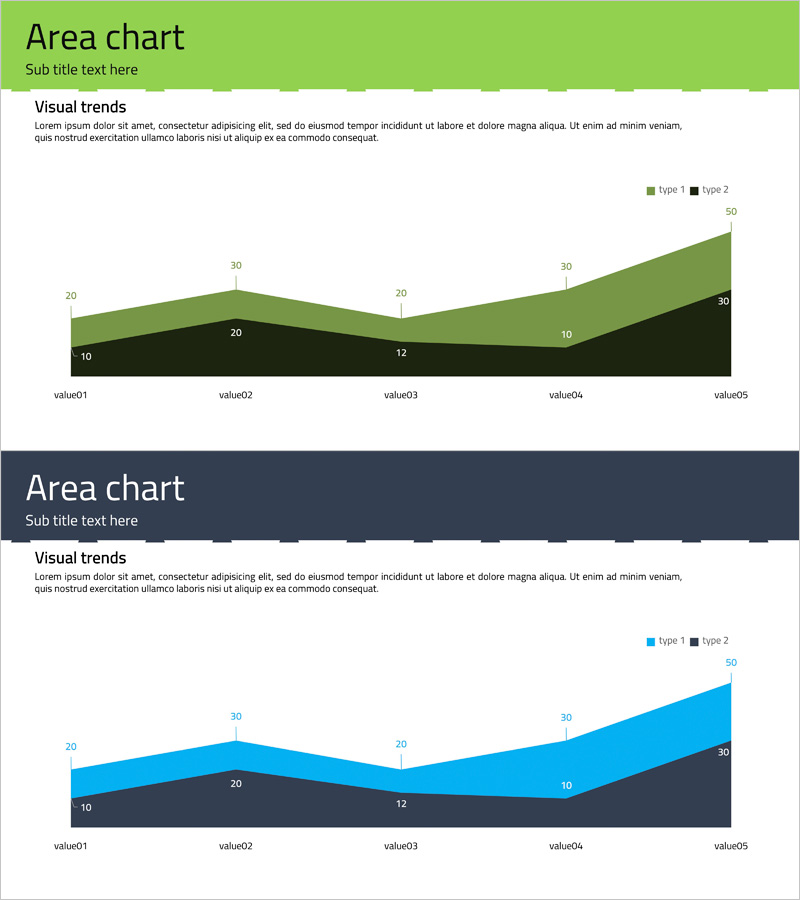
A PowerPoint slide that visualizes business performance and future prospects using a 2-layer stacked area chart in green and navy blue. The chart displays data trends over time with cumulative area representation, making it ideal for investor presentations, business reports, and strategic meetings. The slide includes title, subtitle, descriptive text areas, and a legend for clear communication. In 16:9 widescreen PPTX format, the chart automatically updates when you input new data values.
Usage Points
-
Main Usage
This slide presents business performance metrics and future prospects through a time-series stacked area chart. The 2-layer cumulative visualization effectively communicates growth trends and performance changes to executives, investors, and stakeholders with clear data representation.
-
How to Use
Use this slide in the performance section of business reports, investor pitch decks, quarterly earnings presentations, and strategic planning meetings. Simply input your data values and the chart updates automatically. Customize the title and subtitle to represent different metrics such as revenue, user growth, or market share.
-
Recommended For
Recommended for CFOs, finance teams, business development managers, and executives preparing performance reports and financial analyses. Particularly useful for quarterly earnings calls, shareholder meetings, investor relations presentations, and data-driven strategic decision-making sessions.
-
Slide Structure
The slide features a title and subtitle area at the top, a 2-layer stacked area chart in the center displaying five data points (value01 through value05), a legend with type indicators and maximum value in the upper right, and descriptive text space at the bottom. Data values are displayed directly on the chart for precise information delivery.
Related Products
-

Game Service Operation and Product Sales Performance – Data Visualization
#Company Introduction #Business Strategy #Graph
-

Graph Slide Visualizing Performance and Future Prospects in Pink and Bluegreen
#Company Introduction #Business Strategy #Graph
-

Business Data Overview Slide - Performance Visualization
#Company Introduction #Business Strategy #Graph
-

Circular Graph by Instrument – Performance and Strategy
#Company Introduction #Business Strategy #Graph
