Business Data Overview Slide - Performance Visualization
RB0800074_5
- Last Update 03/28/2025
- File Size 0.1MB
- # of Slides 2
- File Format PPTX
- Slide Ratio 4:3
- Color
Keywords
- #Content-Based Slides
- #Design-Based Slides
- #Company Introduction
- #Business Strategy
- #Graph
- #Other
- #Key Achievements
- #Achievements
- #4:3
- #performance data visualization PPT slide
- #horizontal bar chart PowerPoint
- #business metrics presentation slide
- #how to visualize KPI in PowerPoint
- #quarterly performance report template
About the Product
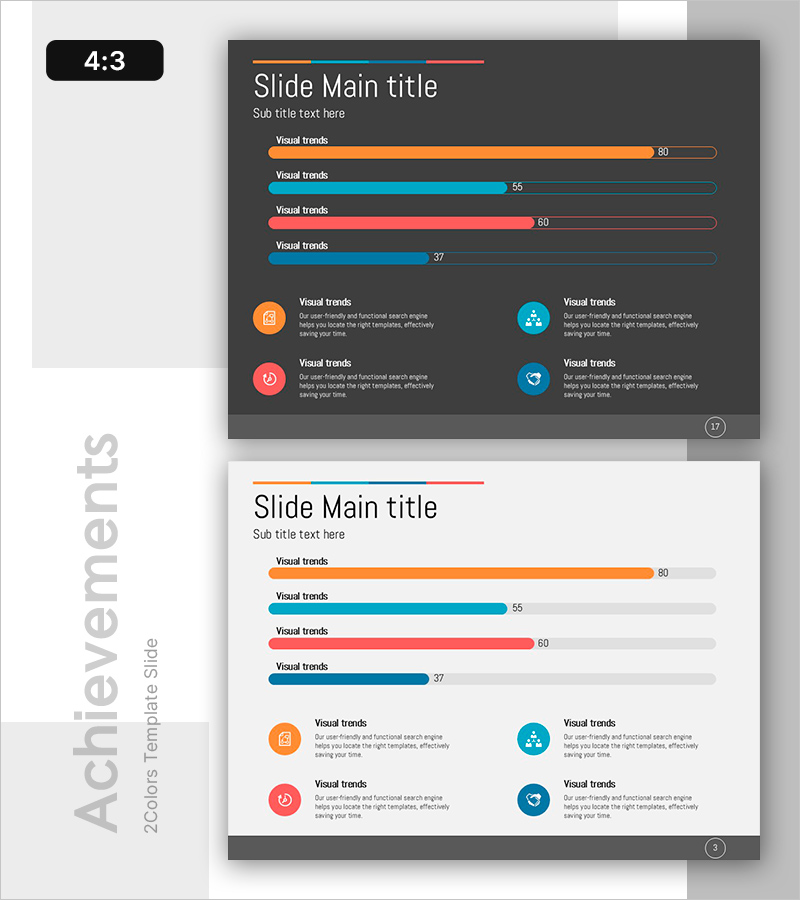
A professional PowerPoint slide set designed to present business performance metrics and key data points with clarity and impact. The dark gray background features four horizontal bar charts in orange, cyan, red, and blue, each displaying numerical values for easy comparison. Below the charts, four circular icons with accompanying text blocks highlight core performance indicators. Two-slide layout includes both dark and light theme versions, making it adaptable for investor presentations, executive briefings, and quarterly performance reviews. Ready to customize with your actual performance data and KPI labels.
Usage Points
-
Main Usage
Communicate quarterly and annual performance results, revenue growth, profit margins, customer satisfaction scores, and other critical KPIs to executives and investors. The combination of bar charts and icons enables simultaneous presentation of quantitative and qualitative achievements.
-
How to Use
Replace the sample bar chart values with your actual performance data and update the icon labels with your key metrics (revenue growth, customer acquisition, market share, etc.). Use the dark theme for boardroom presentations and investor meetings; use the light theme for public announcements and press releases.
-
Recommended For
CFOs and finance teams presenting quarterly earnings, startups pitching to investors, marketing teams reporting campaign results, sales teams sharing quota achievement. Ideal for any executive meeting requiring data-driven decision support and performance transparency.
-
Slide Structure
Slide 1 (dark theme): Title and subtitle area + 4 horizontal bar charts with numerical values + 4 circular icons at bottom + 4 text description blocks. Slide 2 (light theme): identical layout with light background. Total 2 slides, 4:3 aspect ratio, PPTX format.
Related Products
-

Graph Slide Visualizing Performance and Future Prospects in Pink and Bluegreen
#Company Introduction #Business Strategy #Graph
-

Circular Graph by Instrument – Performance and Strategy
#Company Introduction #Business Strategy #Graph
-

Game Service Operation and Product Sales Performance – Data Visualization
#Company Introduction #Business Strategy #Graph
-

Performance and Future Prospects Green Navy – Business Strategy through Data Visualization
#Company Introduction #Business Strategy #Graph
