Curved Theme Purple Template Diagram – Key to Financial Planning
RJ0200068_18
- Last Update 04/18/2025
- File Size 2MB
- # of Slides 2
- File Format PPTX
- Slide Ratio 16:9
- Color
Keywords
- #Content-Based Slides
- #Design-Based Slides
- #Financial Plans and Performance
- #Diagram
- #Capital Requirements
- #Key Financial Indicators
- #Table
- #Standard Table
- #16:9
- #table diagram PowerPoint
- #data comparison slide template
- #financial planning table PPT
- #7-column table slide
- #purple diagram PowerPoint
- #information organization presentation
- #data visualization slide
About the Product
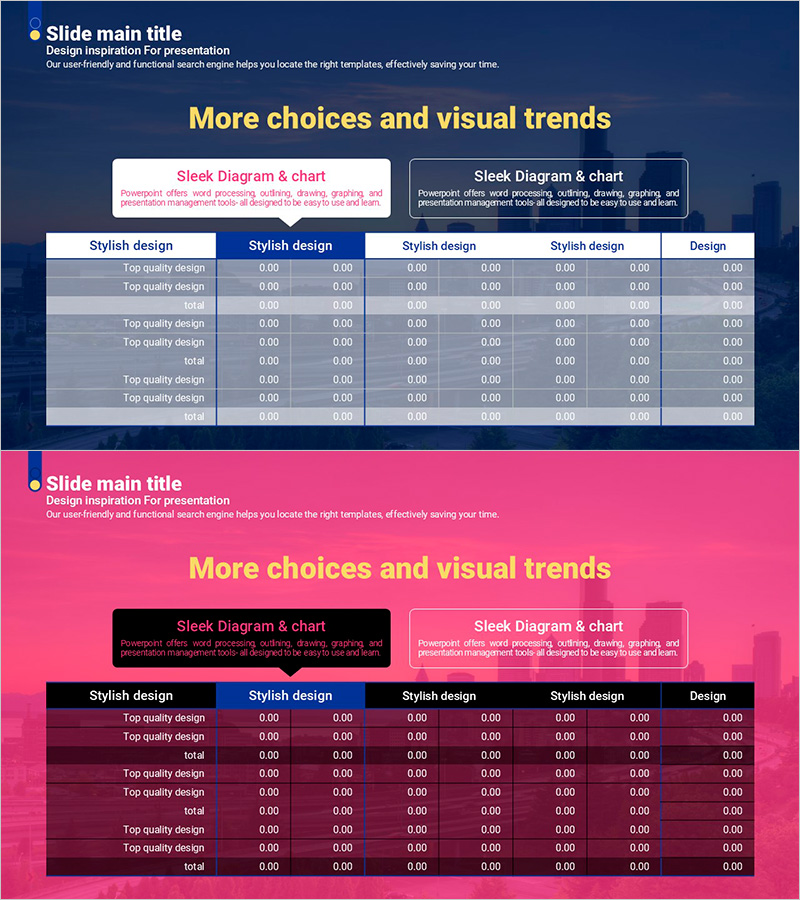
A table diagram PowerPoint slide optimized for financial planning and data comparison analysis. The slide features a purple header row and gray-toned data rows, structured with 7 columns for organizing items and numerical values. Each row is designed to accommodate category names and data entries, making it effective for systematically presenting complex information in presentations. The template includes 2 slides in 16:9 widescreen PPTX format, ready for immediate customization and use.
Usage Points
-
Main Usage
Used to organize and visualize numerical data such as financial plans, budget analysis, and performance metrics. Ideal for comparing multiple items simultaneously or displaying trends over time. Enhances information delivery in reports and proposals by presenting data in a structured, easy-to-read format.
-
How to Use
Simply enter your data into each cell of the table. Modify the header row column titles to define your analysis categories, then input specific numerical values into the data rows. You can add additional rows or adjust colors to highlight important items as needed.
-
Recommended For
Recommended for finance teams, planning departments, and marketing teams preparing reports and proposals. Particularly useful for quarterly performance analysis, budget allocation planning, competitive analysis, and project status updates.
-
Slide Structure
Consists of 2 slides, each featuring a table with 7 columns and 8 rows (1 header row + 7 data rows). The purple header row alternates with gray-toned data rows to enhance readability, and each cell provides sufficient space for numerical data entry.
Related Products
-

Diagram for Visualizing Financial Plans – Grey Brown Design
#Financial Plans and Performance #Diagram #Capital Requirements
-

3 Main Tables and Summary Messages for Financial Insights
#Financial Plans and Performance #Diagram #Text Box
-

Painting Template Table – Visualizing Financial Plans
#Financial Plans and Performance #Diagram #Capital Requirements
-

Patient Examination Item Table Slide – Efficient Data Management
#Financial Plans and Performance #Diagram #Capital Requirements
