Painting Template Table – Visualizing Financial Plans
RJ0600068_14
- Last Update 07/08/2025
- File Size 4.6MB
- # of Slides 2
- File Format PPTX
- Slide Ratio 16:9
- Color
Keywords
- #Content-Based Slides
- #Design-Based Slides
- #Financial Plans and Performance
- #Diagram
- #Capital Requirements
- #Key Financial Indicators
- #Table
- #Standard Table
- #16:9
- #data table PowerPoint slide
- #financial comparison template
- #horizontal table presentation
- #budget analysis slide
- #performance metrics PowerPoint
About the Product
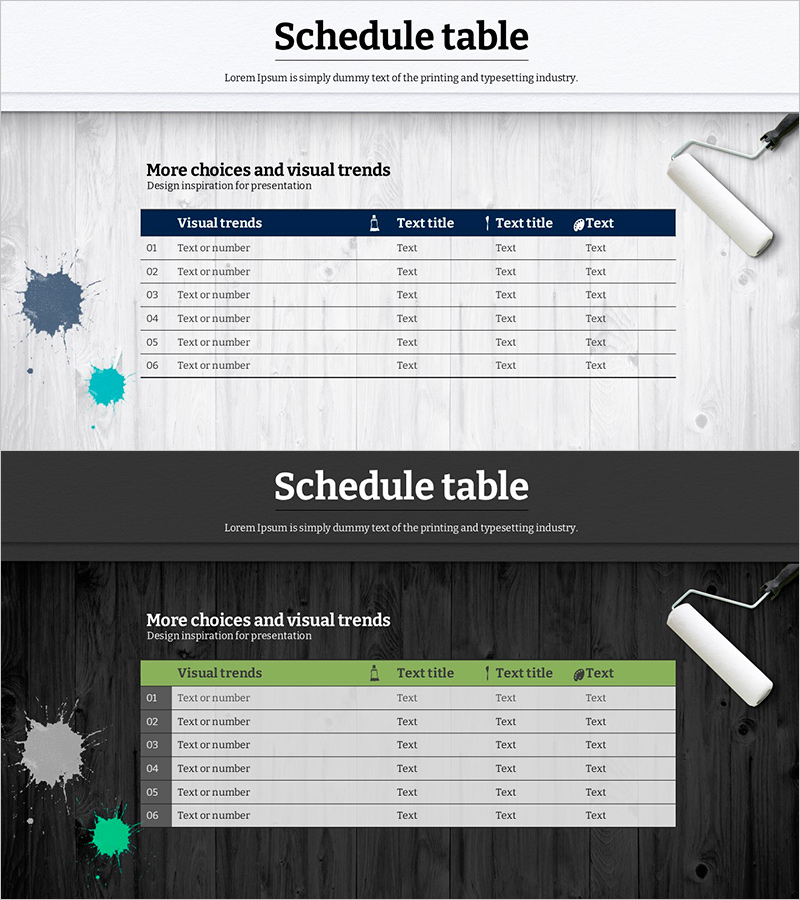
A horizontal data table PowerPoint slide designed for comparing financial plans and actual results at a glance. This 2-slide template features a light wood-tone background with a dark blue header and teal accent elements that create visual cohesion. The 4-column structure is optimized for organizing financial metrics, performance data, and budget items side by side. Each row is numbered (01–06) to establish clear information hierarchy, and the text input areas provide ample space for immediate editing of various financial indicators and performance figures. This practical slide template is ideal for presentations, reports, and performance reviews.
Usage Points
-
Main Usage
Organize and compare financial metrics, budget figures, performance data, and quarterly results across four columns for clear side-by-side analysis. The dark blue header and teal accent elements visually emphasize key information, while the row numbering system (01–06) establishes a structured information hierarchy.
-
How to Use
Use this template in financial reports, business performance presentations, budget review meetings, and quarterly results analysis to display numerical data in table format. Simply replace the header text and cell data with your own content, and adjust colors and fonts to match your existing presentation style for immediate deployment.
-
Recommended For
CFOs, finance managers, executives, project managers, and consultants presenting financial analysis, performance evaluations, and budget planning. Particularly suited for quarterly and annual performance comparisons, budget versus actual spending analysis, and departmental performance metric reviews requiring quantitative data comparison.
-
Slide Structure
2-slide template. Each slide contains a header section (dark blue background with 4 column titles) and a data area with 6 rows (01–06 row numbers plus 4 input cells per row). The light wood-tone background with teal watercolor accent elements adds visual interest, while each cell is sized for optimal text and numerical input.
Related Products
-

Social Network Wide Template Table – Financial Planning and Results
#Financial Plans and Performance #Diagram #Capital Requirements
-

Rainbow Presentation Template Chart and Icons – Enhance Your Financial Planning
#Financial Plans and Performance #Diagram #Capital Requirements
-

Hotpot Table Chart – Clearly Present Financial Performance
#Financial Plans and Performance #Diagram #Capital Requirements
-

Diagram for Visualizing Financial Plans – Grey Brown Design
#Financial Plans and Performance #Diagram #Capital Requirements
