Trend Color Wide Template Table – Emphasizing Financial Planning and Performance
RJ0200045_20
- Last Update 04/11/2025
- File Size 1.8MB
- # of Slides 2
- File Format PPTX
- Slide Ratio 16:9
- Color
Keywords
- #Content-Based Slides
- #Design-Based Slides
- #Financial Plans and Performance
- #Diagram
- #Capital Requirements
- #Key Financial Indicators
- #Table
- #Standard Table
- #16:9
- #table PowerPoint slide
- #financial table presentation
- #6-column comparison table
- #data organization slide
- #financial metrics template
- #horizontal table design
About the Product
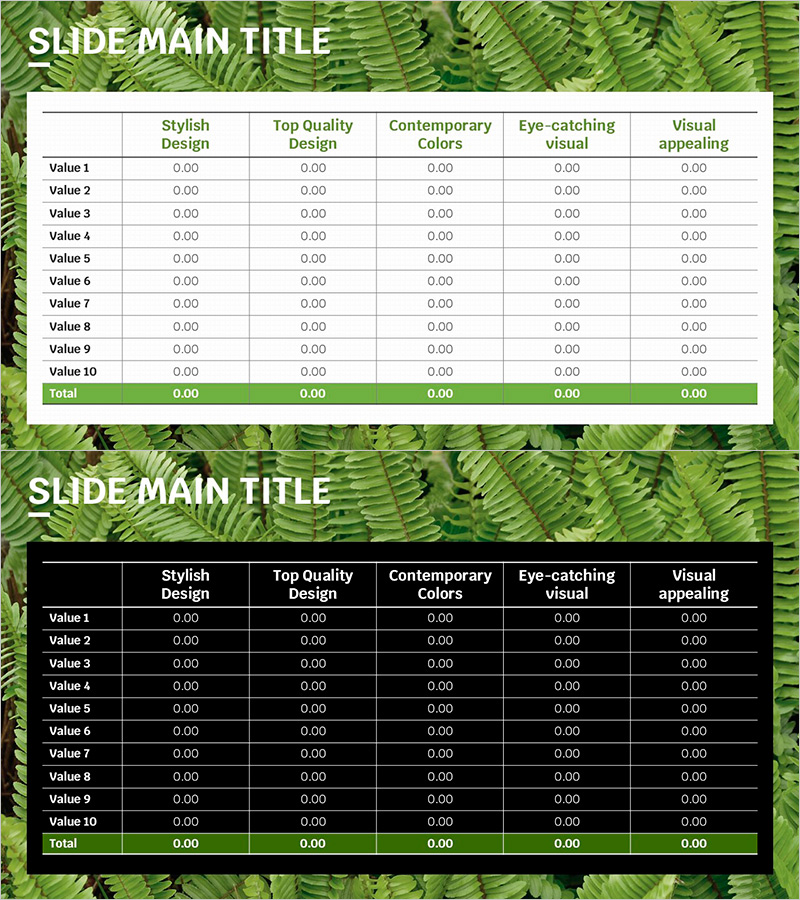
A 6-column horizontal table PowerPoint slide designed for financial planning and performance analysis. The high-contrast design with green background and white text maximizes data readability, while 10 data rows are systematically arranged to display key financial indicators, budget items, and performance comparisons at a glance. The 2-slide set includes both light and dark background versions, allowing you to choose based on presentation environment and document style. Fully editable PPTX format enables quick customization of numbers and item names.
Usage Points
-
Main Usage
Presents financial planning, budget allocation, and performance metrics through systematic comparison and analysis. The 10-row and 6-column structure organizes complex numerical data in a structured format, enhancing audience comprehension.
-
How to Use
Use in business plans, financial reports, and quarterly performance presentations to organize budget status, expense details, revenue comparisons, and cost analysis. Customize by entering data into cells and adding or removing rows and columns as needed.
-
Recommended For
CFOs, finance managers, executives, and business planning teams presenting financial status to employees, investors, and boards. Particularly effective for quarterly performance reviews, budget planning, and cost optimization discussions requiring data-driven decision-making.
-
Slide Structure
2-slide set with light background version (white base with green header) and dark background version (black base with green header). Each slide features 6 columns (Stylish Design, Top Quality Design, Contemporary Colors, Eye-catching visual, Visual appealing, Total) and 10 data rows, with the total row highlighted for emphasis.
Related Products
-

Social Network Wide Template Table – Financial Planning and Results
#Financial Plans and Performance #Diagram #Capital Requirements
-

Curved Theme Purple Template Diagram – Key to Financial Planning
#Financial Plans and Performance #Diagram #Capital Requirements
-

Highlight Table Chart – Clear Visualization of Financial Performance
#Financial Plans and Performance #Diagram #Capital Requirements
-

Hotpot Table Chart – Clearly Present Financial Performance
#Financial Plans and Performance #Diagram #Capital Requirements
