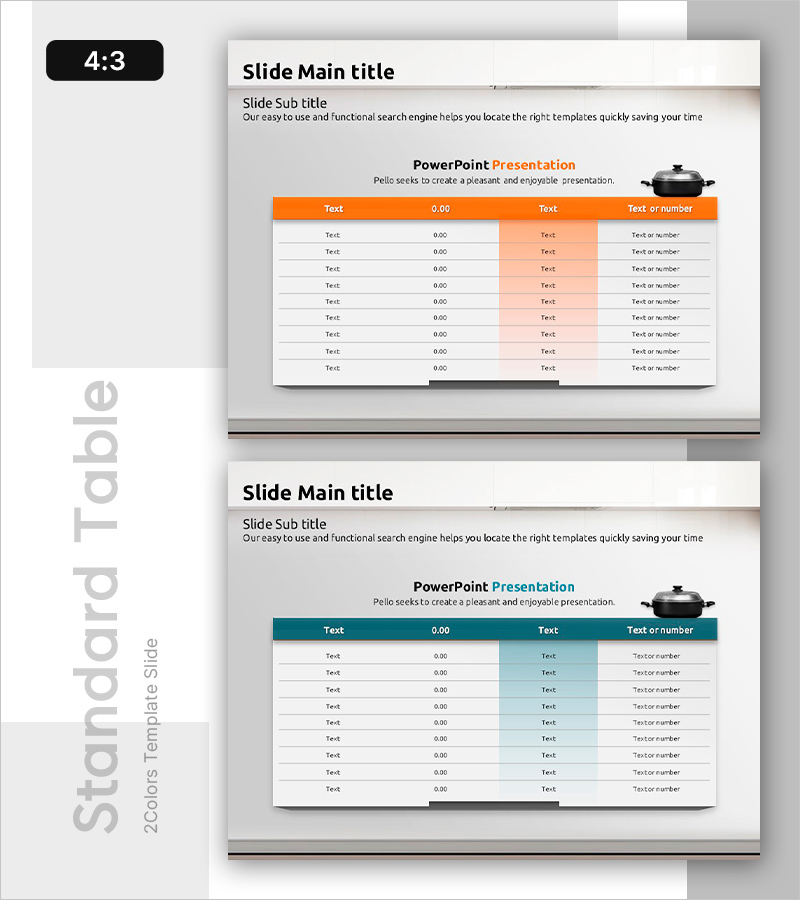
Hotpot Table Chart – Clearly Present Financial Performance
RB0700015_9
- Last Update 03/16/2025
- File Size 0.6MB
- # of Slides 2
- File Format PPTX
- Slide Ratio 4:3
- Color
Keywords
About the Product
A 4-column table PowerPoint slide designed to clearly present financial performance and key metrics. The orange header and light orange accent area visually distinguish important information, with 8 rows of data entry fields. This slide template enables systematic data presentation for reports requiring number comparisons, text entries, and metric analysis. The 2-slide set includes both orange and teal header versions, allowing you to match your presentation's tone and style.
Usage Points
-
Main Usage
Organize financial results, sales figures, departmental metrics, and quarterly outcomes in a clear row-and-column format for audience comparison and analysis. The 8-row, 4-column structure provides ample space for comprehensive data entry and visual hierarchy.
-
How to Use
Replace header row labels ('0.00' and 'Text') with actual metric names and column titles. Fill the 8 data rows with your numbers and text. Use the orange accent column to highlight key figures. Switch between the 2-slide versions to apply different color schemes across presentation sections.
-
Recommended For
Finance team quarterly and annual performance reports, sales team results analysis, executive briefings, business plan presentations, marketing campaign outcome reviews, and departmental KPI assessment meetings requiring data-driven decision support.
-
Slide Structure
2-slide set: orange header version (1 slide) + teal header version (1 slide). Each slide features 4:3 aspect ratio with title area, subtitle area, and 4-column × 8-row table structure. Headers use solid fill color; data cells have white background with light-colored accent areas for emphasis.
Related Products
-

Patient Examination Item Table Slide – Efficient Data Management
#Financial Plans and Performance #Diagram #Capital Requirements
-

Highlight Table Chart – Clear Visualization of Financial Performance
#Financial Plans and Performance #Diagram #Capital Requirements
-

Rainbow Presentation Template Chart and Icons – Enhance Your Financial Planning
#Financial Plans and Performance #Diagram #Capital Requirements
-

3 Main Tables and Summary Messages for Financial Insights
#Financial Plans and Performance #Diagram #Text Box
