Green & Gray Wide Donut Chart Template – Product and Operational Planning
RJ0200067_7
- Last Update 04/18/2025
- File Size 0.6MB
- # of Slides 2
- File Format PPTX
- Slide Ratio 16:9
- Color
Keywords
- #Content-Based Slides
- #Design-Based Slides
- #Product/Service Introduction
- #Financial Plans and Performance
- #Graph
- #Development Status
- #Projected Return on Investment (ROI)
- #Circles
- #Doughnut Chart
- #16:9
- #donut chart PowerPoint
- #pie chart slide template
- #ratio visualization PowerPoint
- #data chart slide
- #how to create donut chart in PowerPoint
- #percentage breakdown slide template
About the Product
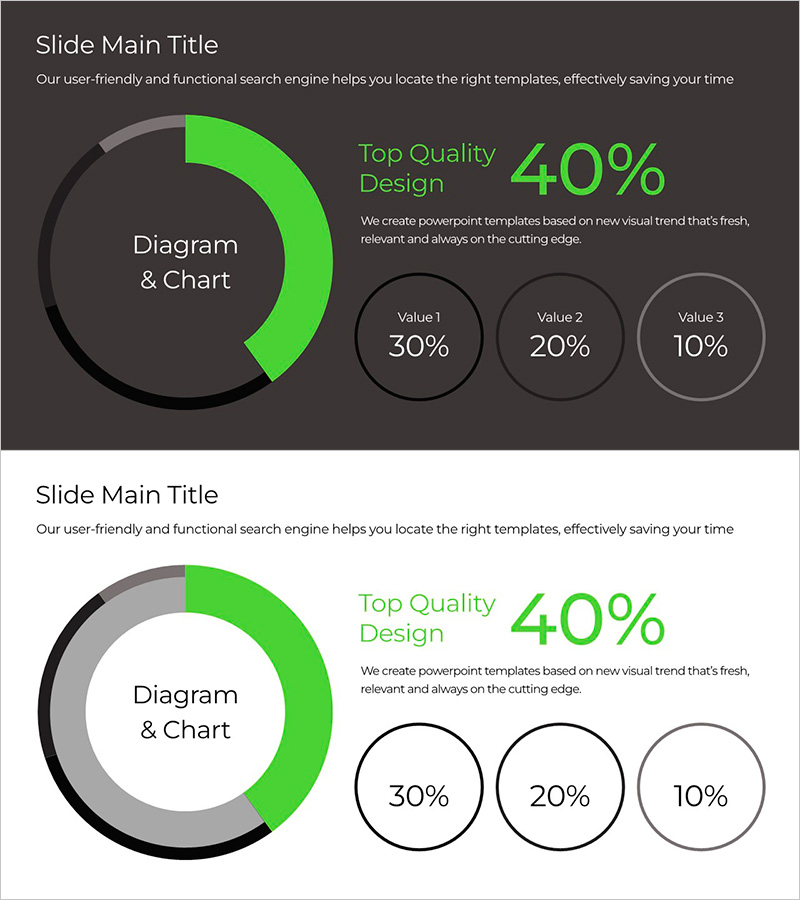
A donut chart PowerPoint slide featuring a lime green accent on a dark background, emphasizing a 40% primary metric in the center ring with three supporting values (30%, 20%, 10%) displayed as circular buttons on the right. Ideal for visualizing product performance, operational metrics, budget allocation, and financial composition. Two background styles—dark and light—are included to match any presentation environment. Provided in 16:9 widescreen PPTX format, fully editable and ready to customize with your data.
Usage Points
-
Main Usage
Effectively communicate proportional data such as market share, budget distribution, revenue composition, customer satisfaction scores, and performance metrics. The centered donut ring highlights the primary value while supporting circular elements provide secondary breakdowns, enabling clear hierarchical data presentation.
-
How to Use
Open the slide, enter your title and description in the text area on the right, and update the chart percentages with your actual data. The lime green color conveys growth and positivity, making it perfect for achievement reports, goal completion announcements, and upward trend presentations. Choose the dark background for premium impact or the light background for an approachable, friendly tone.
-
Recommended For
Executive reports, quarterly performance reviews, investor presentations, marketing strategy meetings, financial analysis sessions, and operational planning discussions. Frequently used by product managers, finance teams, marketing departments, and business planning groups.
-
Slide Structure
Slide 1: Dark background version with lime green donut chart on the left (40% center ring with three circular buttons showing 30%, 20%, 10%), title and description text area on the right. Slide 2: Light background version with identical donut structure. All shapes and text elements are fully editable.
Related Products
-

Scientific Development Status and Doughnut Chart – Visual Data Representation
#Product/Service Introduction #Financial Plans and Performance #Graph
-

Modern Business Plan PowerPoint Template – Visualizing Financial Performance with Infographic Elements
#Product/Service Introduction #Financial Plans and Performance #Graph
-

Analysis graph of market share progress
#Product/Service Introduction #Market and Competitor Analysis #Graph
-

Business Project Development Status Analysis Graph
#Product/Service Introduction #Business Introduction #Graph
