Modern Business Plan PowerPoint Template – Visualizing Financial Performance with Infographic Elements
RJ0200015_11
- Last Update 04/01/2025
- File Size 5.2MB
- # of Slides 2
- File Format PPTX
- Slide Ratio 16:9
- Color
Keywords
- #Content-Based Slides
- #Design-Based Slides
- #Product/Service Introduction
- #Financial Plans and Performance
- #Graph
- #Development Status
- #Projected Return on Investment (ROI)
- #Circles
- #Doughnut Chart
- #16:9
- #donut chart PowerPoint
- #pie chart slide template
- #financial performance visualization
- #ratio comparison diagram
- #business infographic slide
About the Product
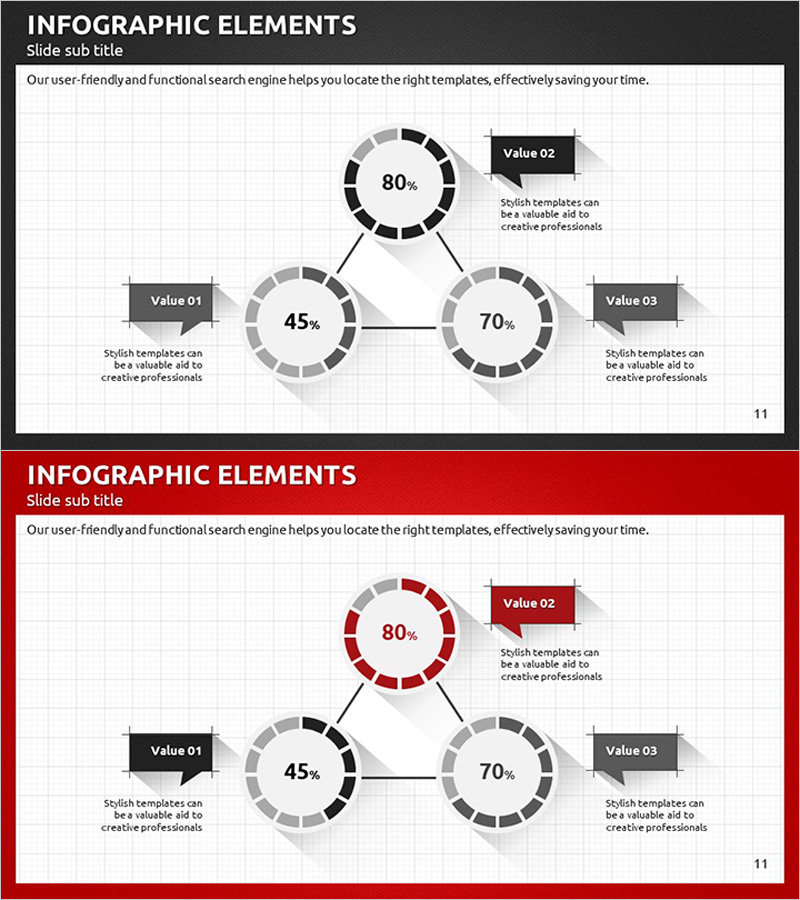
A PowerPoint slide featuring three donut-shaped pie charts to display financial performance metrics simultaneously. The central 80% primary indicator connects to the left 45% and right 70% secondary indicators via connector lines, clearly showing data relationships. Gray and black segment designs enable intuitive ratio comparison, while speech bubble callouts allow detailed explanations for each value. This presentation slide is ready to use in business plans, performance reports, and investment pitches to visualize financial results, market share, goal achievement rates, and other key metrics.
Usage Points
-
Main Usage
Simultaneously compare and analyze three ratio datasets such as financial performance, market share, and goal achievement rates. The hierarchical relationship between the central primary indicator and left-right secondary indicators is visually expressed to enhance audience comprehension.
-
How to Use
Replace each donut chart's percentage values with your own data and input metric names and descriptions in the speech bubble callouts. Adjust the gray-to-black segment ratio based on emphasis priorities, and use connector lines to express cause-and-effect relationships between data points.
-
Recommended For
CFOs, finance managers, executives, and business development teams presenting quarterly or annual performance reports, investment pitches, and business plans. Particularly effective when explaining three or more key performance indicators (KPIs) simultaneously.
-
Slide Structure
Two-slide set: Slide 1 features black background with three gray donut charts and black speech bubble callouts; Slide 2 has red background with gray-and-red hybrid donut charts and red callouts. Both slides are 16:9 widescreen format in PPTX, with all elements fully editable.
Related Products
-

Green & Gray Wide Donut Chart Template – Product and Operational Planning
#Product/Service Introduction #Financial Plans and Performance #Graph
-

Scientific Development Status and Doughnut Chart – Visual Data Representation
#Product/Service Introduction #Financial Plans and Performance #Graph
-

Analysis of Transportation Usage Status – Pie Chart
#Product/Service Introduction #Market and Competitor Analysis #Graph
-

Graph of Analysis of Transportation Development Status
#Product/Service Introduction #Market and Competitor Analysis #Graph
