Green & Gray Template Wide Vertical Bar Chart – Performance Visualization
RJ0200067_5
- Last Update 04/18/2025
- File Size 0.4MB
- # of Slides 2
- File Format PPTX
- Slide Ratio 16:9
- Color
Keywords
About the Product
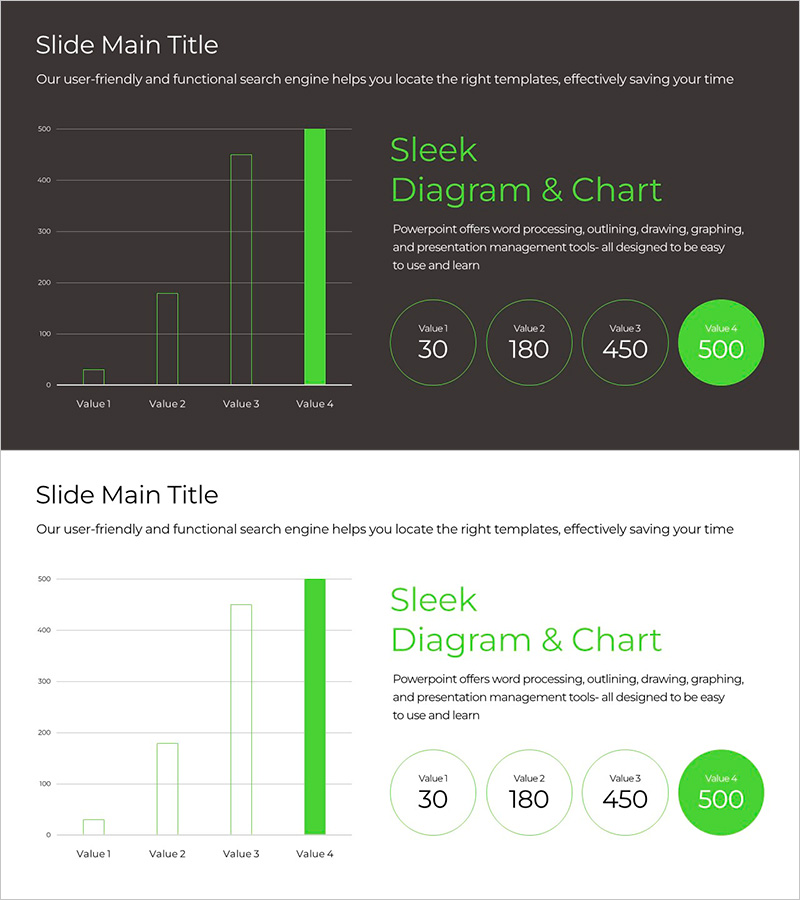
A vertical bar chart PowerPoint slide designed to clearly visualize business performance and results. The two-tone green and gray color scheme emphasizes data comparison, with four items represented by bar heights for intuitive numerical expression. Complemented by circular gauge elements, this slide effectively communicates both achievement metrics and performance indicators simultaneously. Available in 16:9 widescreen format with 2 slides ready for immediate editing and deployment across various business presentations including quarterly performance reports, strategic initiative tracking, and team results presentations.
Usage Points
-
Main Usage
Optimized for comparing and visualizing numerical data such as business performance, quarterly results, and team goal achievement through bar height representation. The circular gauge elements enable simultaneous display of individual item goal attainment rates, making this ideal for comprehensive performance analysis presentations.
-
How to Use
Open the slide and replace the chart values with your actual data, then adjust the circular gauge values accordingly. Use the green accent color to highlight top-performing items or apply gray tones to establish baseline references for clear comparative analysis. Customize text areas with item names and descriptions to match your presentation context.
-
Recommended For
Executive reports, quarterly performance presentations, strategic initiative meetings, team results analysis, investor performance briefings, marketing campaign outcome reviews, sales goal achievement assessments, and all business presentations requiring quantitative data-driven decision-making.
-
Slide Structure
Two-slide set with each slide featuring a 4-item vertical bar chart paired with four circular gauges on the right. The first slide uses a dark charcoal background with bright green accent color, while the second slide presents the same chart structure on a light background, allowing selection based on presentation environment and design preference.
Related Products
-

Renewable Energy Bar Graph – Performance and Strategy
#Business Strategy #Financial Plans and Performance #Graph
-

Breaking Sales Records – Visualizing Performance
#Business Strategy #Financial Plans and Performance #Graph
-

Analysis by Figures with Horizontal Bar Chart – Data-Driven Market Strategy
#Business Strategy #Market and Competitor Analysis #Graph
-

Visualizing Performance with 3 Vertical Bar Graphs – Market and Competitor Analysis
#Business Strategy #Market and Competitor Analysis #Graph
