Performance Column Graph – Business Strategy and Competitor Analysis
RB0800030_7
- Last Update 03/24/2025
- File Size 3.9MB
- # of Slides 2
- File Format PPTX
- Slide Ratio 4:3
- Color
Keywords
- #Content-Based Slides
- #Design-Based Slides
- #Business Strategy
- #Market and Competitor Analysis
- #Graph
- #Achievements
- #Future Outlook
- #Column
- #Column Chart
- #4:3
- #column chart PowerPoint
- #vertical bar graph slide template
- #performance comparison chart
- #data visualization presentation
- #competitor analysis slide
About the Product
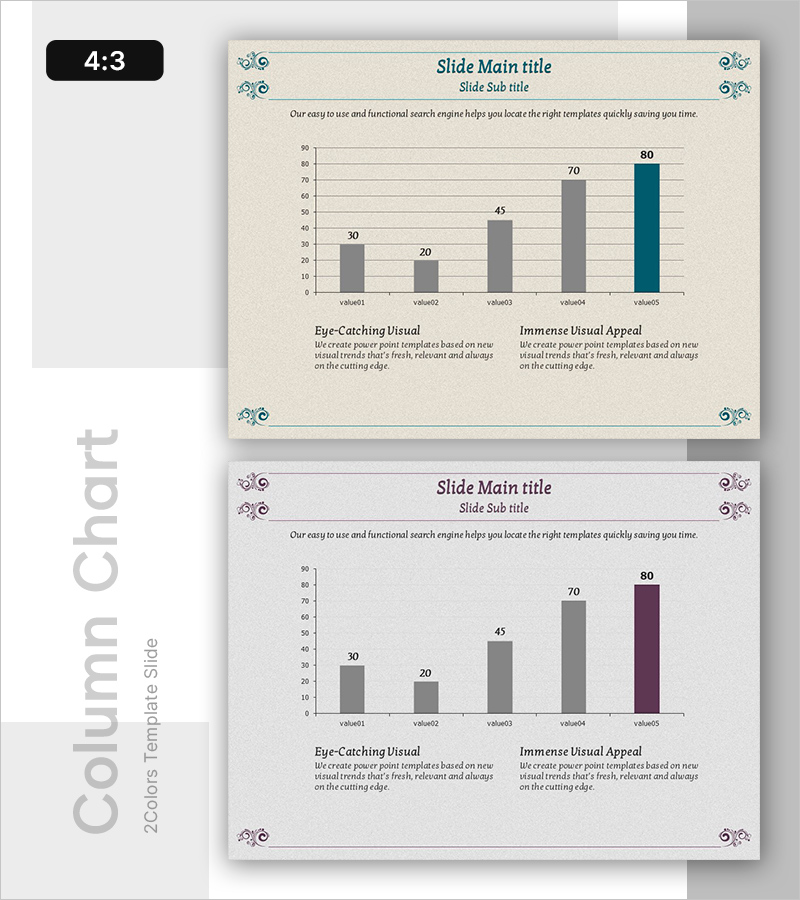
A vertical column chart PowerPoint slide designed for business performance and competitor analysis presentations. This slide template features five data items displayed as columns with a two-tone color scheme—gray bars with a teal accent on the final item to emphasize key metrics. Numerical labels appear above each column for precise data communication. The slide includes two insight sections at the bottom: 'Eye-Catching Visual' and 'Immersive Visual Appeal,' providing context for data interpretation. Available in 4:3 aspect ratio with 2 slides ready for immediate use in your presentation deck.
Usage Points
-
Main Usage
Ideal for comparing business performance metrics, sales figures, or competitive benchmarking across five categories. The varying column heights create intuitive visual hierarchy, while the teal accent color draws attention to the highest-performing item, making data differences immediately apparent to your audience.
-
How to Use
Enter your presentation title and subtitle in the header area. Replace the value01–value05 labels with your actual category names, then adjust column heights to match your dataset. Add key insights or conclusions in the two text boxes below the chart to reinforce your data narrative.
-
Recommended For
Recommended for marketing reports, quarterly performance reviews, executive briefings, investor presentations, and consulting proposals. Ideal for professionals in management, marketing, sales, and analytics roles who need to present quantitative results persuasively.
-
Slide Structure
Slide 1: Title and subtitle area + 5-item vertical column chart (value01–value05 with numerical labels) + 2 insight text boxes. Slide 2: Identical layout with burgundy accent color variation. 4:3 aspect ratio, PPTX format, 2-slide set.
Related Products
-

Market Trends and Analysis Charts – Delivering Business Insights
#Business Strategy #Market and Competitor Analysis #Graph
-

Exercise Ability Improvement Graph
#Business Strategy #Market and Competitor Analysis #Graph
-

Vertical Bar Graph Flow – Market and Performance Analysis
#Business Strategy #Market and Competitor Analysis #Graph
-

Visualizing Performance with 3 Vertical Bar Graphs – Market and Competitor Analysis
#Business Strategy #Market and Competitor Analysis #Graph
