Target Sales Vertical Bar Graph - Visualizing Business Performance
RJ0900025_24
- Last Update 08/23/2025
- File Size 0.6MB
- # of Slides 2
- File Format PPTX
- Slide Ratio 16:9
- Color
Keywords
- #Content-Based Slides
- #Design-Based Slides
- #Business Vision and Strategy
- #Business Strategy
- #Diagram
- #Graph
- #Business Goals
- #Achievements
- #Flow
- #Column
- #Column Chart
- #16:9
- #vertical bar chart PowerPoint
- #sales target slide
- #business performance visualization
- #data comparison slide
- #how to create bar chart in PowerPoint
About the Product
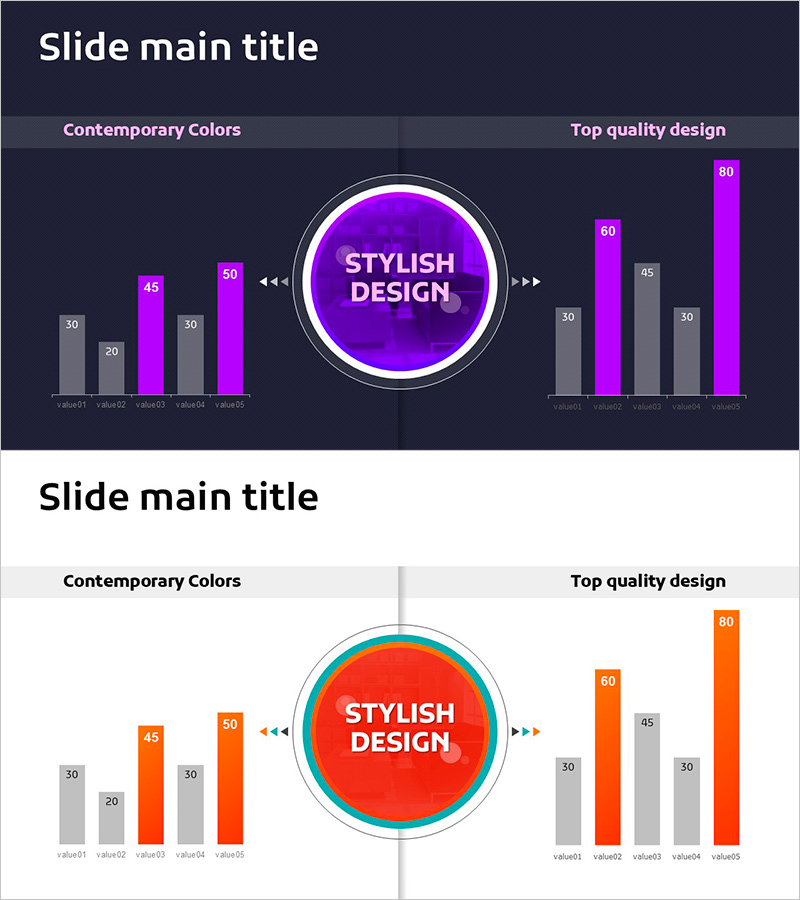
A vertical bar chart PowerPoint slide designed to visualize business performance and sales targets. The dark background with purple and orange accent colors maximizes data contrast, allowing five data points to be compared at a glance. The central circular badge emphasizes key messages, making it ideal for sales forecasts, departmental performance comparisons, quarterly trends, and executive presentations. Provided in 16:9 widescreen format with 2 slides in PPTX, fully editable for custom values and labels.
Usage Points
-
Main Usage
Visualizes sales targets versus actuals, departmental or product performance comparisons, and monthly or quarterly trend analysis. The central circular badge draws attention to key metrics, making data-driven insights immediately clear to audiences.
-
How to Use
Insert into business reports, quarterly earnings presentations, executive briefings, or marketing performance reviews. Replace bar heights and numerical labels with actual data, and modify item names and legends as needed. The dark background ensures excellent visibility in projector environments.
-
Recommended For
Finance managers, sales directors, marketing analysts, executive presenters, and business performance analysts. Particularly suited for management meetings and shareholder reports requiring data-driven decision-making.
-
Slide Structure
Two-slide set. First slide features a dark background with left-side 5-item vertical bars (gray and purple), center purple circular badge (STYLISH DESIGN text), and right-side 5-item vertical bars (gray, purple, and orange mix) in symmetrical layout. Second slide provides the same structure on a light background for printing and diverse presentation environments.
Related Products
-

Animal Performance Graphs PowerPoint Template
#Business Vision and Strategy #Business Strategy #Diagram
-

Visualizing Facility Performance Metrics and Process Stages - Business Outcomes and Goals
#Business Vision and Strategy #Business Strategy #Diagram
-

Blue Orange Vertical Bar Chart – Emphasizing Creativity
#Company Introduction #Business Strategy #Graph
-

Procedure and Direction Slide for Business Goals and Action Plans
#Business Vision and Strategy #Business Management #Diagram
